Mexichem Reports Triple Digit Net Income Growth With Record-Breaking Second Quarter 2018 Results
Mexichem, S.A.B. de C.V. (BMV: MEXCHEM*) (“the Company” or “Mexichem”) announced its unaudited results for the second quarter of 2018. The figures have been prepared in accordance with International Financial Reporting Standards (“NIIF” or “IFRS”), having US dollars as the functional and reporting currency. All comparisons are made against the same period of the prior year except for Netafim's 1Q17 P&L figures, which are not included in the comparisons, but proforma financials are included in this report in Appendix I. Unless specified to the contrary, all figures are in millions. In the comments in this report, we will refer to the term “Organic Basis” or “Organically” which means that it will exclude: i) Netafim's results for the quarter, ii) CADE and Netafim Ltd. Acquisition related expenses and iii) Brazil tax legal settlement benefit. In some cases, numbers and percentages have been rounded and may not add up.
This press release features multimedia. View the full release here: https://www.businesswire.com/news/home/20180725006005/en/
Sales by Region (Destination) (Graphic: Business Wire)
Mexichem posted a 29% year-over-year increase in EBITDA to $423 million, on a 35% year-over-year increase in revenue to $1.97 billion. This is the highest quarterly EBITDA in Mexichem’s history, and validates the company’s balanced strategy of organic and acquisition growth.
During the quarter, Mexichem reported EBITDA margin of 21.5%, while EBIT increased 42% to $317 million, YOY. Consolidated net income of $206 million was also up sharply compared to the $92 million reported during last year’s second quarter. Free cash flow increased 76% YOY to $88 million.
“This has been another exciting quarter of significant success that validates the strategies and plans that we have been executing to transform Mexichem,” said Daniel Martinez-Valle, Mexichem CEO. “During this journey, we have been identifying different challenges in all markets in which we have been playing, and using our creativity and the innovations across all our business units to solve them. We are strongly encouraged that we are executing the right strategy to continue our already robust momentum.”
First half 2018 financial and operating highlights include:
- Revenues increased 30% to $3.7 billion.
- EBITDA grew 42% to $753 million and EBITDA Margin increased 170 bps to 20.2%. EBIT increased 57% to $543 million.
- Consolidated net income totaled $317 million an increase of 119%.
|
FINANCIAL HIGHLIGHTS: |
||||||||||||||||||
| mm US$ | Second Quarter | January - June | ||||||||||||||||
|
Financial Highlights |
2018 | 2017 | %Var. | 2018 | 2017 | % Var. | ||||||||||||
| Net sales | 1,968 | 1,463 | 35 | % | 3,724 | 2,857 | 30 | % | ||||||||||
| Operating income | 317 | 224 | 42 | % | 543 | 345 | 57 | % | ||||||||||
| EBITDA | 423 | 327 | 29 | % | 753 | 529 | 42 | % | ||||||||||
| EBITDA margin | 21.5 | % | 22.3 | % | -84 bps | 20.2 | % | 18.5 | % | 170 bps | ||||||||
| Income (loss) from continuing operations | 186 | 88 | 111 | % | 297 | 140 | 112 | % | ||||||||||
| EBT | 262 | 151 | 74 | % | 425 | 228 | 86 | % | ||||||||||
| Consolidated net income (loss) | 206 | 92 | 124 | % | 317 | 145 | 119 | % | ||||||||||
| Net majority income | 162 | 67 | 142 | % | 241 | 119 | 103 | % | ||||||||||
| Operating cash flow before capex | 219 | 135 | 62 | % | 212 | 129 | 64 | % | ||||||||||
| Total CAPEX (organic & JV) | (70 | ) | (60 | ) | 17 | % | (136 | ) | (142 | ) | -4 | % | ||||||
| Cash Flow before dividends | 150 | 76 | 97 | % | 76 | (12 | ) | N/A | ||||||||||
| Free cash flow | 88 | 50 | 76 | % | (60 | ) | (65 | ) | -8 | % | ||||||||
MANAGEMENT COMMENTARY
STRATEGY, PERFORMANCE AND BUSINESS UNIT HIGHLIGHTS, AND OUTLOOK
The first half of 2018 confirms that Mexichem’s balanced strategy of organic and acquisition growth is yielding significant results. The company’s focus on so-called “human-centered” solutions, where Mexichem identifies vexing infrastructure challenges and then develops – or acquires and applies – intelligent solutions to address them, is starting to gain traction globally. Mexichem’s strategic approach to the businesses and markets that we serve, has resulted in strong financial performance. In fact, all our businesses continue to grow.
Mexichem relies on both acquisitions and organic growth for our success. Since 2003, Mexichem has acquired 27 companies. Part of our success comes from the effective integration of these companies into the broader Mexichem family. Currently, we are focused on the successful integration of Netafim Ltd., an Israeli company that holds tremendous promise in what we call “intelligent ruralization.” As far as organic growth is concerned, and with respect to capital allocation, our priorities include value-added and digitally-enabled projects we launched during Q2, including Sentio and Wavin Spotlight solutions. Also during the quarter, our recently incorporated acquisition Netafim launched Netbeat, which is also a value-added digital-enabled solution for farmers.
Mexichem is also strongly committed to our investment-grade rating, and through our continued effort to strengthen our balance sheet, we have reached 1.98x net debt to EBITDA ratio at the end of this second quarter.
We deeply believe that a strategic combination of acquisition, organic growth, innovation, and keen, administrative oversight of financial performance is what has transformed Mexichem into a global leader and a multinational, integrated organization, stronger today than at any other time in our history.
We are embarking on a journey to transform Mexichem into a purpose-led, future fit organization. This means that our organization is identifying infrastructure issues and challenges in communities and countries around the world and developing innovations to solve them. This approach to our business is as much about identifying today’s challenges as it is about analyzing growth trajectories and predicting and addressing the challenges of tomorrow. We believe we have the right people with the right expertise, identifying and developing the right innovations as we transform Mexichem into a global, human-centered innovator, focused on addressing our customers’ needs, and improving the lives of people around the world. We expect to share more details about these initiatives during upcoming months.
Given our 2018 trajectory, we are increasing guidance assumptions, and now anticipate 25% to 30% growth in EBITDA for the FY. This increase from 20-25% to 25-30% in our guidance comes from the success we had during the first half of the year when we operated in a supply constrained environment in the markets we serve in our Fluor and Vinyl’s Business Groups which acted jointly with seasonality factors. For the second half of 2018 we continue seen favorable market conditions in Vinyl, same ones that have allowed us to expand our opportunities and strengthened our market position, while in Fluent, the organizational delayering we executed during 2017 together with favorable market conditions in Europe and USA/Canada, and the steady recovery in LatAm, has been supporting our results along the year and it is expected to continue doing so during the rest of 2018. However, we also believe that the supply constrained environment and seasonality that benefited our Fluor Business Group during the first half of 2018 will start to moderate, alongside with the 2H18 planned overhauls in our Japanese and US plants.
SECOND QUARTER FINANCIAL RESULTS
REVENUES
For Q2 2018, revenues totaled $1.97 billion, up $505 million, or 35% from Q2 2017, led by higher sales in all our business groups. Organically, revenue increased 15% YOY, or $219 million. Sales for our Fluent, Fluor and Vinyl Business Groups increased by 49%, 29% and 12%, respectively.
The Fluent Business Group reported double-digit organic growth of 11%. Growth was driven mainly by improved sales performance in Fluent Europe, US/Canada, LatAm and AMEA. In Fluor, growth came from solid fluorspar demand and better pricing across the value chain due to seasonality and supply market constraints. Finally, Vinyl benefited from improved PVC pricing and the caustic soda environment compared to last year’s second quarter, as well as our geographic diversification.
The exchange rate translation effect for Q2 2018 in sales had a negative impact of $135 million including Venezuela and a positive impact of $31 million excluding Venezuela, on a consolidated basis compared to Q2 2017, mainly because of the depreciation of the Venezuelan Bolivar (6,362%) and the Brazilian Real (11.8%), and partially offset by the appreciation of the Euro (7.8%) and the British pound (6.1%). On an Organic Basis, without the FX translation effect (not affecting cash flow, but to understand the overall business and segment performance), revenues would have been $1.8 billion, up $354.3 million or 24%, including the Venezuelan monetary effect, and $1.7 billion, up $188 million or 13%, excluding the Venezuelan monetary effect.
As a result, during the first half of the year, revenues increased by 30% to $3.7 billion, an increase of $867 million. In an Organic Basis and without the FX translation effect, during the 1H2018 revenues would increase 15% to $3.3 billion, an increase of $439 million.
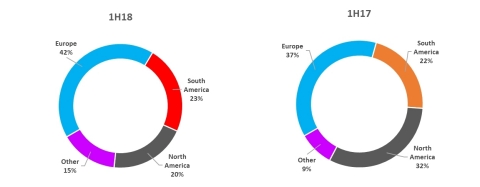
SALES BY REGION (DESTINATION):
The United States and Mexico represented 15% and 11%, respectively, of total sales by destination in 1H18; Germany accounted for 8%, and Brazil and the UK represented 6% each.
EBITDA
In Q2 2018 EBITDA was $423 million, a 29% increase from the $327 million reported in the same quarter last year. EBITDA margin for the quarter was 21.5%. On an Organic Basis, EBITDA would have been $370 million, an increase of 13% with an implied EBITDA margin of 22%.
Double-digit EBITDA growth was reached by each business group, which represents a historic achievement for the Company. In the Fluent, Fluor and Vinyl Business Groups, EBITDA increased by 45%, 44% and 14%, YOY respectively.
Overall positive results for the quarter were attributable to: i) improved sales performance and market dynamics in both U.S. and Europe in Fluent and Fluor Business Groups; ii) signs of recovery for Fluent LatAm and AMEA; iii) the consolidation of Netafim’s results in to Mexichem results; and iv) sound prices of our Vinyl Business Group products.
In 2Q18 the foreign exchange translation effect on EBITDA was negative equating to $152 million including Venezuela and was immaterial excluding Venezuela, on consolidated basis, due to the same currencies affecting revenues. On an Organic Basis, without the FX translation effect, EBITDA would have been $522 million, up $195 million or 60% increase including the Venezuela effect, and $362 million, up $35 million or 11% excluding the Venezuela effect.
For the first six months of 2018, EBITDA was $753 million, increasing 42%. EBITDA margin was 20.2%. On an Organic Basis, without the FX translation effect, EBITDA would have been $842 million, an increase of 59%.
OPERATING INCOME
Mexichem reported operating income for 2Q18 of $317 million, compared to $224 million reported in 2Q17, an 42% increase. On an Organic Basis, operating income increased $46 million or 21%, to $270 million.
For the 1H18, in reported and on an Organic Basis, operating income was $543 million and $476 million, respectively, compared to the $345 million reported in the same period of 2017, representing an increase of 57% and 38% respectively.
FINANCIAL COSTS
In 2Q18 financial costs decreased by $19 million, or 26%, to $54 million compared to 2Q17. The decrease was triggered by: i) a positive reduction in exchange rate losses when compared to 2Q17 ii) FX gains related to the Mexican peso denominated debt and to other net liabilities in currencies that were depreciated against the dollar, iii) a positive inflationary variation derived from our operation in Venezuela due to its hyper-inflationary environment applied to our net monetary position, generating a positive effect as our monetary liabilities were much higher than our monetary assets during the 2Q18 when compared to 2Q17. These effects were offset by an increase of $12 million in interest expenses and bank commissions, out of which $11 million are due to the $1 billion bond issued in September 2017 for the Netafim acquisition, and the remainder coming from the consolidations of Netafim into Mexichem results.
In 1H18, financial costs increased by $2 million, or 2%, to $119 million, compared to 1H17. This occurred because of the increase in $23 million in interest from the $1 billion bond issued in September 2017 and $5 million from the consolidation of Netafim into Mexichem results, offset by a reduction of $2 million in interest gain, $24 million in monetary position and $4 million in exchange rate effects, due to the same factors mentioned previously.
TAXES
In Q218, income from continuing operations before income taxes (EBT) increased 74% while cash taxes increased 55%, reducing the cash tax rate from 26.4% from Q2 2017 to 23.7% during Q2 2018. This was mainly due to: i) accounting profits related to the start-up of commercial operations of the ethylene cracker that occurred during Q2 2017 that did not have an associated tax because of the use of bonus depreciation, and ii) a reduction in the corporate tax rate from 35% to 21% in the U.S. associated with the US tax reforms that occurred during the second half of 2017.
Deferred taxes in Q2 2017 increased due to the reduction in deferred asset taxes because of their usage against local fiscal exchange rate gains (which are not for accounting purposes) due to the Mexican peso devaluation, an effect that that did not occur in Q2 2018 due to a more stable exchange rate behavior. This effect generates a $9 million deferred tax reduction.
The combined effect in the cash and deferred taxes produces a reduction in the effective tax rate from 42% in Q2 2017 to 29% in Q2 2018.
In the 1H18 the effective tax rate decreased to 30% from 39% due to the factors explained previously.
CONSOLIDATED NET INCOME (LOSS) AND MAJORITY INCOME (LOSS)
During Q2 2018, PMV accrued a net deferred tax adjustment on the value of the assets inside the Pajaritos Petrochemical complex that discontinued in Q4 2017 to reflect the appraisal value of those assets.
In Q2 2018, the Company reported Consolidated Net Income of $206 million and Net Majority Income of $162 million, compared to reported Consolidated Net Income and Net Majority Income of $92 and $67 million, respectively, in Q2 2017. These results reflect the higher Operating Income and EBITDA reported in this year’s second quarter and the lower cash tax rate mentioned above.
For the first half of 2018, the Company posted a $317 million Consolidated Net Income and $241 million in Net Majority Income, compared to $145 million and $119 million reported in the same period of 2017 respectively.
| USD in millions | Second Quarter | January - June | |||||||||||||||||
| Income statement | 2018 | 2017 | % | 2018 | 2017 | % | |||||||||||||
| Income (loss) from continuing operations before income tax | 262 | 151 | 74 | % | 425 | 228 | 86 | % | |||||||||||
| Cash tax | 62 | 40 | 55 | % | 114 | 70 | 63 | % | |||||||||||
| Income (loss) from continuing operations after cash tax | 200 | 111 | 80 | % | 311 | 158 | 97 | % | |||||||||||
| Deferred taxes | 14 | 23 | -39 | % | 13 | 18 | -28 | % | |||||||||||
| Income (loss) from continuing operations | 186 | 88 | 111 | % | 297 | 140 | 112 | % | |||||||||||
| Discontinued operations | (20 | ) | (4 | ) | 400 | % | (20 | ) | (6 | ) | 233 | % | |||||||
| Consolidated net income (loss) | 206 | 92 | 124 | % | 317 | 145 | 119 | % | |||||||||||
| Minority stockholders | 44 | 25 | 76 | % | 76 | 26 | 192 | % | |||||||||||
| Net income (loss) | 162 | 67 | 142 | % | 241 | 119 | 103 | % | |||||||||||
| BALANCE SHEET AND OPERATING CASH FLOW HIGHLIGHTS | ||||||||||||||||||||
| OPERATING CASH FLOW HIGHLIGHTS | ||||||||||||||||||||
| Second Quarter | January - June | |||||||||||||||||||
| mm US$ | 2018 | 2017 | %Var. | 2018 | 2017 | % Var. | ||||||||||||||
| EBITDA | 423 | 327 | 29 | % | 753 | 529 | 42 | % | ||||||||||||
| Taxes paid | (78 | ) | (40 | ) | 95 | % | (132 | ) | (70 | ) | 89 | % | ||||||||
| Net interest paid | (49 | ) | (36 | ) | 36 | % | (94 | ) | (72 | ) | 31 | % | ||||||||
| Bank commissions | (11 | ) | (8 | ) | 38 | % | (22 | ) | (13 | ) | 69 | % | ||||||||
| Exchange rate gains (losses) | (22 | ) | (16 | ) | 38 | % | (32 | ) | (12 | ) | 167 | % | ||||||||
| Change in trade working capital (1) (2) | (44 | ) | (91 | ) | -52 | % | (261 | ) | (233 | ) | 12 | % | ||||||||
| Operating cash flow before capex | 219 | 135 | 62 | % | 212 | 129 | 64 | % | ||||||||||||
| CAPEX (Organic) | (65 | ) | (46 | ) | 41 | % | (126 | ) | (95 | ) | 33 | % | ||||||||
| CAPEX (Total JV) | (5 | ) | (24 | ) | -79 | % | (11 | ) | (86 | ) | -87 | % | ||||||||
| CAPEX JV (OXY share) | - | 11 | -100 | % | - | 39 | -100 | % | ||||||||||||
| NET CAPEX JV | (5 | ) | (13 | ) | -62 | % | (11 | ) | (47 | ) | -77 | % | ||||||||
| Total CAPEX (organic & JV) | (70 | ) | (60 | ) | 17 | % | (136 | ) | (142 | ) | -4 | % | ||||||||
| Cash flow before dividends | 150 | 76 | 97 | % | 76 | (12 | ) | N/A | ||||||||||||
| Shareholders' dividend | (62 | ) | (26 | ) | 138 | % | (136 | ) | (53 | ) | 157 | % | ||||||||
| Free cash flow | 88 | 50 | 76 | % | (60 | ) | (65 | ) | -8 | % | ||||||||||
| PMV's insurance A/R | 268 | - | 268 | - | ||||||||||||||||
| Free cash flow after Insurance | 355 | 50 | 610 | % | 207 | (65 | ) | N/A | ||||||||||||
| (1) PMV's insurance A/R is not included in trade working capital calculation. | ||||||||||||||||||||
| (2) Trade working capital variation (Jun 18 vs Dec 17) includes Netafim's proforma results for comparative purposes. | ||||||||||||||||||||
- Operating Cash Flow before Capex increased by 62%, an increase of 95% in taxes paid and a 36% increase in interest paid, which were related to higher income from continuing operations before taxes and higher debt. Also, we experienced a 38% increase in FX rate losses, which was offset by a decrease in the demand of working capital. The latter is mainly a result of a recovery on accounts receivables from Vinyl Business Group. Capital expenditures in Q2 2018 increased by 17% to $70 million.
|
NET WORKING CAPITAL |
||||||||||||||
| 2018 Variation | 2017 Variation | |||||||||||||
| Jun-18 |
Dec-17 |
∆ ($) |
Jun-17 |
Dec-16 |
∆ ($) |
|||||||||
| Trade Working Capital | 771 | 510 | (261) | 417 | 184 | (233) | ||||||||
From December 31, 2017 to June 30, 2018, working capital needs increased by $261 million, compared with the same period a year earlier that increased $233 million. The increase of $28 million between the 1H17 and 1H18 was due to the consolidation of Netafim into Mexichem results and higher sales across the Company's business groups.
| FINANCIAL DEBT | |||||||
| Last Twelve Months | |||||||
| Jun 2018 | Dec 2017 | ||||||
| Net Debt USD million | 2,748 | 1,356 | |||||
| Net Debt/EBITDA 12 M | 1.98x | 1.23x | |||||
| Interest coverage | 6.21x | 5.67x | |||||
| Net debt USD includes $0.6 million of letters of credit with maturities of more than 180 days that for covenant purposes are considered debt, although they are not booked in the accounting debt |
Total financial debt as of June 30, 2018 was $3.6 billion, while cash and cash equivalents totaled $905 million, resulting in net financial debt of $2.7 billion.
In mid-April, we reached a $323 million settlement with our insurance providers related to the accident that occurred in our PMV joint venture facility two years ago. A total of $55.5 million was advanced by the insurance companies during 2016 and 2017. The balance of $267.5 million covered the receivable which was cancelled in May 2018 upon payment by the insurance company. The settlement included property damages, assembly insurance policies and business interruption. For more information about PMV, please see the PMV Closing Remarks section included in the Vinyl BG comments in this report.
The Net Debt/EBITDA ratio was 1.98x as of June 30, 2018, while Interest Coverage was 6.2x.
|
CONSOLIDATED BALANCE SHEET |
||||||
| USD in millions | ||||||
| Balance sheet | Jun 2018 | Dec 2017 | ||||
| Total assets | 10,406 | 9,759 | ||||
| Cash and temporary investments | 905 | 1,900 | ||||
| Receivables | 1,413 | 975 | ||||
| Inventories | 872 | 675 | ||||
| Others current assets | 263 | 403 | ||||
| Property, plant and equipment, Net | 3,531 | 3,626 | ||||
| Intangible assets and Goodwill | 3,217 | 1,910 | ||||
| Long term assets | 205 | 270 | ||||
| Total liabilities | 6,786 | 6,078 | ||||
| Current portion of long-term debt | 374 | 45 | ||||
| Suppliers | 1,515 | 1,362 | ||||
| Other current liabilities | 787 | 723 | ||||
| Long-term debt | 3,278 | 3,210 | ||||
| Long-term employee benefits | 184 | 186 | ||||
| Long-Term deferred tax liabilities | 215 | 231 | ||||
| Other long-term liabilities | 433 | 321 | ||||
|
Consolidated shareholders' equity |
3,620 | 3,681 | ||||
| Minority shareholders' equity | 921 | 878 | ||||
| Majority shareholders' equity | 2,699 | 2,803 | ||||
| Total liabilities & shareholders' equity | 10,406 | 9,759 | ||||
| CONSOLIDATED INCOME STATEMENT | ||||||||||||||
| USD in millions | Second Quarter | January - June | ||||||||||||
| Income Statement | 2018 | 2017 | % | 2018 | 2017 | % | ||||||||
| Net sales | 1,968 | 1,463 | 35% | 3,724 | 2,857 | 30% | ||||||||
| Cost of sales | 1,393 | 1,074 | 30% | 2,675 | 2,160 | 24% | ||||||||
| Gross profit | 575 | 389 | 48% | 1,048 | 697 |
50% |
||||||||
| Operating expenses | 258 | 165 | 56% | 505 | 352 | 43% | ||||||||
| Operating income (loss) | 317 | 224 | 42% | 543 | 345 | 57% | ||||||||
|
Interest expenses & bank commissions |
63 | 50 | 26% | 126 | 98 | 29% | ||||||||
| Interest income | (3) | (6) | -50% | (10) | (12) | -17% | ||||||||
| Exchange rate, net | 16 | 25 | -36% | 31 | 35 | -11% | ||||||||
| Monetary position | (19) | 5 | N/A | (26) | (2) | 1200% | ||||||||
| Equity in income of associated entity | (1) | - | (2) | (1) | 100% | |||||||||
| Financial Costs | 54 | 73 | -26% | 119 | 117 | 2% | ||||||||
| Income (loss) from continuing operations before income tax | 262 | 151 | 74% | 425 | 228 | 86% | ||||||||
| Cash tax | 62 | 40 | 55% | 114 | 70 | 63% | ||||||||
| Deferred taxes | 14 | 23 | -39% | 13 | 18 | -28% | ||||||||
| Income tax | 76 | 64 | 19% | 128 | 88 | 45% | ||||||||
| Income (loss) from continuing operations | 186 | 88 | 111% | 297 | 140 | 112% | ||||||||
| Discontinued operations |
(20) |
(4) |
400% |
(20) |
(6) |
233% | ||||||||
| Consolidated net income (loss) | 206 | 92 | 124% | 317 | 145 | 119% | ||||||||
| Minority stockholders | 44 | 25 | 76% | 76 | 26 | 192% | ||||||||
| Net income (loss) | 162 | 67 | 142% | 241 | 119 | 103% | ||||||||
| EBITDA | 423 | 327 | 29% | 753 | 529 | 42% | ||||||||
| OPERATING RESULTS BY BUSINESS GROUP | ||||||||||||||
| VINYL Business Group (34% and 42% of Mexichem’s sales (before eliminations) and EBITDA, respectively, in 2018) | ||||||||||||||
| mm US$ | Second Quarter | January - June | ||||||||||||
| Vinyl | 2018 | 2017 | %Var. | 2018 | 2017 | % Var. | ||||||||
| Volume (K tons) | 654 | 638 | 3% | 1,298 | 1,281 | 1% | ||||||||
| Total sales* | 642 | 571 | 12% | 1,287 | 1,170 | 10% | ||||||||
| Operating income | 111 | 89 | 25% | 216 | 142 | 52% | ||||||||
| EBITDA | 161 | 141 | 14% | 313 | 224 | 40% | ||||||||
| *Intercompany sales were $47 million and $52 million in 2Q18 and 2Q17, respectively. And as of June 2018 and 2017 were $88 million and $96 million, respectively. | ||||||||||||||
| mm US$ | Second Quarter | January - June | ||||||||||||
| Resins, Compounds & Derivatives | 2018 | 2017 | %Var. | 2018 | 2017 | % Var. | ||||||||
| Volume (K tons) | 567 | 573 | -1% | 1,136 | 1,151 | -1% | ||||||||
| Total sales* | 619 | 558 | 11% | 1,245 | 1,141 | 9% | ||||||||
| Operating income | 103 | 86 | 20% | 201 | 135 | 49% | ||||||||
| EBITDA | 150 | 136 | 10% | 293 | 211 | 39% | ||||||||
| *Intercompany sales were $56 million and $59 million in the Q2 2018 and Q2 2017, respectively, and as of June 2018 and 2017 were $104 million and $110 million, respectively. Of these amounts $9 million and $8 million were invoiced to PMV in Q2 2018 and Q2 2017, respectively and $17 million and $14 million accrued to June 2018 and 2017. | ||||||||||||||
| mm US$ | Second Quarter | January - June | ||||||||||||
| PMV | 2018 | 2017 | %Var. | 2018 | 2017 | % Var. | ||||||||
| Total sales* | 32 | 23 | 39% | 61 | 46 | 33% | ||||||||
| Operating income | 8 | 2 | 300% | 15 | 7 | 114% | ||||||||
| EBITDA | 11 | 5 | 120% | 21 | 13 | 62% | ||||||||
| *Intercompany sales invoiced to Resins, Compounds and Derivatives were $0.6 million and $1.6 million in Q2 2018 and Q2 2017, respectively. And, as of June 2018 and 2017 were $1.5 million and $2.8 million, respectively. | ||||||||||||||
In Q2 2018, the Vinyl Business Group reported 12% sales growth to $642 million on a 3% increase in volume, reflecting stronger PVC market price conditions associated with higher oil prices and Asian supply constraints, together with better market prices in caustic soda than the same period last year.
EBITDA for the Vinyl Business Group was $161 million, compared to $141 million in Q2 2017, an increase of 14%. This growth resulted mainly from the efficiencies in our operations, and the benefits of our increased vertical integration across the ethane-to-PVC value chain at our JV ethylene cracker in Texas. EBITDA margin rose to 25.1% in Q2 2018 from the to 24.7% reported after Q2 2017.
Resins, Compounds and Derivatives volumes decreased 1% on 11% revenue growth, reflecting strong market price conditions both in PVC and caustic soda. EBITDA grew $14 million, or 10%, to $150 million, with a flat implied EBITDA margin of 24.2%.
PMV revenues grew 39% to $32 million, while EBITDA grew 120% because of better-than-expected caustic soda market price conditions and higher volumes than during Q2 2017. EBITDA margin grew 1,100 bps to 34% from 23% during the same period last year.
For the first half of the year, Vinyl revenues increase 10% on 1% volume growth, reflecting favorable market price conditions on PVC and caustic soda largely due to the increase in oil prices when compared 1H18 to 1H17. EBITDA increased 40% to $313 million from the $224 million reported at the end of Q2 2017, with EBITDA margin growth of 510 bps to 24.3% from Q2 2017’s 19.2%.
Resins, Compounds and Derivatives volumes decreased 1% while revenues increased 9% due to better market conditions as explained above. EBITDA increased by $82 million or 39% from $211 million to $293 million resulting in an EBITDA margin of 23.5% or 500 bps higher than the 18.5% in 1H17.
Revenues and EBITDA in PMV grew 33% and 62% respectively, because of supply constraints experienced during the 1H18 which created better than expected market-price conditions. PMV's EBITDA margins increased 500 bps to 34% from 29%.
PMV Closing Remarks
- On July 6, 2018, Mexichem reached an agreement for the acquisition of 44.09% share in PMV. The transaction amounts to approximately $178.7 million dollars, which is within the valuation ranges of comparable businesses and previous transactions in the petrochemical sector.
- In May, PMV received $268 million from the insurance company, related to the $323 million settlement reached in mid-April with the insurance providers. This was related to the accident that occurred in our PMV VCM plant two years ago and includes property damages, assembly insurance policies and business interruption.
- On December 20, 2017, Mexichem announced the decision of PMV's board of Directors not to rebuild its VCM production capacity. Therefore, the joint venture’s VCM production, and the assets and liabilities associated with ethylene production and auxiliary services associated with VCM and ethylene were classified on that date as discontinued operations in Mexichem’s financial statements for the years 2015, 2016 and 2017. This constitutes the exit of PMV from the VCM and ethylene businesses in Mexico. This decision triggered the asset write-off of the ethylene plant and auxiliary services related to the VCM and ethylene plants for $196 million, and PMV did not recognize any recovery value for the discontinued assets due to the inability to value those assets. PMV performed an appraisal to determine the recovery value of those assets and during Q2 2018, accrued a net deferred tax adjustment on the value of the assets inside the Pajaritos Petrochemical to reflect the appraisal value of those assets.
- Thus, all the impacts and the revenues recognized by PMV related to the incident in the VCM plant, since then, are presented as discontinued operations except for the business interruption related to the chlorine-caustic soda plant.
On April 20, 2016, an unfortunate accident occurred in the VCM plant (Clorados III) inside the Pajaritos Petrochemical Complex. PMV complied with all its human, regulatory and economic obligations and responsibilities.
The ministerial authorities, both local and federal, who had the responsibilities of investigating in the first case, presumed crimes of common law (for example, physical and/or property damages to individuals, not related to crimes under federal jurisdiction), and in the second case, presumable crimes under federal jurisdiction (for example, damage to the environment or federal property damage), after thorough investigations, analyzed and assessed all the evidence resulting from their inquiries.
The Veracruz State Prosecutor's Office (local ministerial authorities), in their investigation report, determined that an unfortunate accident occurred because of a sudden and unexpected release of gas caused by the rupture of the third elbow of 90° in the 54P circuit at the exit of the column AS-401C, which also happened in an unpredictable manner without the cause of the failure was provoked by any overpressure, that the thickness of the pipe was not adequate for the pressure at which it was operated, or that there was evidence of an intentional act or environmental condition that caused the pipe to rupture. The report itself deduces that the most probable cause of the explosion was the presence of chemical reactions, which caused the structural modification of the metal of the pipe, causing loss of resistance and thus inducing the failure and the release of gases.
After the investigation of the Veracruz State Prosecutor's Office was concluded and that its determination was that the cause of the unfortunate accident was the result of an eventual and fortuitous situation, not foreseeable, given its contingent nature, the Federal Attorney General's Office that was also conducting an investigation, into possible environmental impact from the explosion, as well as potential damage to the property of Petroleos Mexicanos adjacent to the Clorados III plant, attracted the Veracruz State Prosecutor's Office investigation and concluded said investigations, declaring that non-exercise of the criminal action would be taken against any company or person because, as indicated in the declaration of origin of the non-exercise of the criminal action, the explosion occurred in the Clorados III plant was not the result of a careless, imperious, negligent, reckless or fraudulent act by the company or any person. Further, the investigations determined that there was no intent or fault by PMV as a company, or any employees because they were diligent in implementing and executing all necessary, predictive, preventive and corrective maintenance of the equipment and control and security instruments of said facility. Finally, the investigations determined that the explosion was a result of external factors that caused a build-up of external pressure in the pipes, which led to a rupture and gas leakage, generating a carbureted mixture of chemical substances that ultimately found a hot spot and combusted. Therefore, in the absence of fraud or fault, the excluder of liability was updated.
PMV also hired an internationally recognized, independent investigator, specializing in vapor cloud explosions (VCE) to determine the cause of the unfortunate accident. His conclusion was that the release was sudden and unexpected and there was no warning for those who were outside of the unit or those monitoring in the control room. The investigation also found that the leakage of chemicals before the blast was caused by the failure of an 18-inch elbow pipe from the AS 401-C cooling column and that the cause of the elbow failure was the loss of thickness of its lower section due to a combination of what appears to be both internal and external corrosion (CUI). This report states that the next inspection date for the elbow according to the 2014 inspection was scheduled for October 16, 2018, and the withdrawal date was July 22, 2023; as a result, accelerated corrosion and elbow failure were unexpected and that no force, impact or other external contact caused the elbow to fail.
Thus, four expert opinions were carried out, three from ministerial authorities and one independent. All expert reports were conducted in accordance with internationally accepted scientific protocols that can determine the cause of the accident. The results of the four investigations all agree that the cause of the explosion was the result of a fortuitous event.
As for potential environmental impact, three types of potential damage were presumed, namely: i) to the atmosphere, ii) to elements of the environment outside of Clorados III and iii) to the elements of the environment inside Clorados III.
Regarding the atmosphere, on April 12, 2018, a compensation agreement was signed for indirect effects on the atmosphere through which PMV would acquire carbon credits and remove materials from land defined by PROFEPA / SEMARNAT, in compensation for the greenhouse gases in equivalents of CO2 and hydrochloric acid released during the explosion and fire. To date, said measures imposed in the compensatory agreement have been fully complied with and environmental authorities have been notified.
Regarding elements of the environment outside of Clorados III, the following studies were carried out, all ordered by the environmental authorities: Wind Dispersion Study; External Characterization to Clorados III; Environmental Risk Assessment; and Evaluation of the Risk to Human Health; same that were carried out by an institution certified by the Federal Attorney for Environmental Protection (PROFEPA) and by the Mexican Accreditation Entity, in partnership with an international environmental services and integrated engineering firm, approved by the Environmental Protection Agency from United States. These studies determined that the exposure to the concentrations of the presumed critical pollutants generated by the accident, on the part of workers or residents, present and future, outside of Clorados III, does not represent a risk to human health; and that the conditions of exposure by wild and aquatic organisms are very minor, and that any potential ecological risk is not significant, so no remediation or compensation actions are necessary. To date, the environmental authorities are analyzing the information requested by them and delivered by PMV.
Regarding the presumed indirect effects on the elements of the environment within Clorados III, the studies have been carried out and the remediation plan has been submitted to the authority for authorization.
We thank PMV employees, customers, suppliers, contractors, authorities, investors, advisors and managers, for the support shown during this process.
| FLUENT Business Group (55% and 38% of Mexichem’s sales (before eliminations) and EBITDA, respectively, in 2018) | ||||||||||||||
| mm US$ | Second Quarter | January - June | ||||||||||||
| Fluent | 2018 | 2017 | %Var. | 2018 | 2017 | % Var. | ||||||||
| Sales | 1,144 | 770 | 49% | 2,090 | 1,472 | 42% | ||||||||
| Fluent LatAm | 278 | 267 | 4% | 547 | 539 | 1% | ||||||||
| Fluent Europe | 387 | 349 | 11% | 737 | 649 | 14% | ||||||||
| Fluent USA & Canada | 150 | 122 | 23% | 263 | 221 | 19% | ||||||||
| Fluent AMEA | 44 | 37 | 19% | 83 | 74 | 12% | ||||||||
| Netafim | 286 | - | 463 | - | ||||||||||
| Intercompany eliminations | (2) | (5) | -60% | (3) | (11) | -73% | ||||||||
| Operating income | 138 | 90 | 53% | 202 | 132 | 53% | ||||||||
| EBITDA | 180 | 124 | 45% | 283 | 202 | 40% | ||||||||
In Q2 2018, the Fluent Business Group’s sales were $1.1 billion, a 49% increase, compared to the $770 million reported one year ago, mainly driven by the consolidation of Netafim Ltd. into Mexichem results, and higher sales in all the regions including LatAm and AMEA. On an Organic Basis, the Fluent Business Group’s sales would have grown 11% to $857 million.
|
2Q17 |
mm US$ |
2Q18 |
2Q18 |
2Q18/2Q17 |
||||||
| Sales | Sales | FX | Total | % Var | ||||||
| 267 | Fluent LatAm | 278 | 182 | 460 | 72% | |||||
| 349 | Fluent Europe | 387 | (23) | 364 | 4% | |||||
| 122 | Fluent US/Canada | 150 | - | 150 | 23% | |||||
| 37 | Fluent AMEA | 44 | - | 44 | 19% | |||||
| - | Netafim | 286 | (1) | 285 | ||||||
| (5) | Intercompany Eliminations | (2) | - | (2) | -60% | |||||
| 770 | Total | 1,144 | 158 | 1,302 | 69% | |||||
| Fluent LatAm is affected by $182 million given the Venezuela FX effect of $166 million, if we were to exclude it, Fluent LatAm would have registered a negative effect of $15 million, and for Fluent would have been positive for $8 million. |
In an Organic Basis and adjusting by the FX translation effect, total sales in the Fluent Business Group would have been $1.0 billion or 332% higher including the Venezuela effect, and $850 million or 10% higher without Venezuela effect, representing a $158 million negative impact and $8 million positive impact year-over-year, respectively.
During Q2 2018, the Fluent Business Group’s EBITDA increased 45% to $180 million, compared to $124 million in Q2 2017. This positive performance includes the consolidation of Netafim Ltd., into Mexichem results, the Netafim Ltd. acquisition expenses and a positive legal tax settlement of $4.8 million in Brazil.
EBITDA margin of 15.8% declined 30 bps compared to 16.1% in Q2 2017. On an Organic Basis, EBITDA totaled $126 million, a 2% increase, compared to the same quarter of the previous year, with an implied EBITDA margin of 14.8%. This excluded the tax legal settlement benefit from Brazil in Fluent LatAm.
EBITDA on an Organic Basis and adjusted by the FX translation effect (not affecting cash flow but helps to understand the company's and its segments performance) grew 130%, or $161 million, including Venezuela translation effect and is immaterial without that effect.
Operating income increased 53% to $138 million, but on an Organic Basis was flat.
In the first half of the year, sales reached $2 billion, an increase of 42% compared to the same period last year. Key factors contributing to this growth include the consolidation of Netafim, Ltd. into Mexichem results, and double-digit growth in Europe, USA/Canada and AMEA, and moderate growth in LatAm. EBITDA increased 40% during 1H 2018, with an implied EBITDA margin of 14%. On an Organic Basis and adjusted by the FX translation effect EBITDA would have increased by 91%, compared to same half of the previous year, with an implied EBITDA margin of 22%.
| FLUOR Business Group (11% and 25% of Mexichem’s sales (before eliminations) and EBITDA, respectively, in 2018) | ||||||||||||||
| mm US$ | Second Quarter | January - June | ||||||||||||
| Fluor | 2018 | 2017 | %Var. | 2018 | 2017 | % Var. | ||||||||
| Sales | 230 | 179 | 28% | 434 | 318 | 36% | ||||||||
| Operating income | 93 | 59 | 58% | 164 | 97 | 69% | ||||||||
| EBITDA | 105 | 73 | 44% | 189 | 123 | 54% | ||||||||
In Q2 2018, the Fluor Business Group reported a 28% increase in sales, reflecting significant growth in both the upstream and downstream parts of the business due to improved demand for fluorspar, mainly coming from the cement industry, and higher downstream prices in the U.S. and Europe, related to seasonality factors and a supply constrained environment during Q2 2018, which continued from Q1 2018.
EBITDA in Q2 2018 grew 44% year-over-year to $105 million, and EBITDA margin was 46%, up from 41% in Q2 2017. Operating income was $93 million, a 56% year-over-year increase.
In 1H18, revenues and EBITDA were up 36% and 54% at $434 million and $189 million respectively, mainly from the abovementioned factors. EBITDA margin increased 480 bps to 43.6% from 38.8% in 1H17. In the first six months of 2018, operating income has grown 69% to $164 million.
RECENT EVENTS
For all the news please visit the following webpage http://www.mexichem.com/news/
Conference Call Details
Mexichem will host a conference call to discuss our 2Q18 results on July 26, 2018 at 10:00 am Mexico City /11:00 am NY. To access the call, please dial 001-855-817-7630 (Mexico), or 1-888-339-0721 (United States) or 1-412-317-5247 (International). Participants may pre-register for the conference call here.
A recording of the webcast will be posted on the website within several hours after the call is completed. The webcast can be accessed via the following link: https://services.choruscall.com/links/mexichem180726.html
The replay can be accessed via Mexichem’s website at www.mexichem.com
| RECONCILIATION SUMMARY BY BUSINESS GROUP | ||||||||||||
| Second quarter 2018 Financial and Operating Highlights | ||||||||||||
| Q2 2017 |
mm US$ |
Q2 2018 | Q2 2018 | Q2 2018/Q2 2017 | ||||||||
| Sales | Sales | FX | Total | % Var | ||||||||
| 571 | Vinyl | 642 | (18) | 624 | 9% | |||||||
| 770 | Fluent | 1,144 | (8) | 1,136 | 48% | |||||||
| 1,341 | Ethylene (Vinyl + Fluent) | 1,786 | (26) | 1,760 | 31% | |||||||
| 179 | Fluor | 230 | (5) | 225 | 26% | |||||||
| - | Energy | - | - | - | ||||||||
| (57) | Eliminations / Holding | (48) | - | (48) | -16% | |||||||
| 1,463 | Total | 1,968 | (31) | 1,937 | 32% | |||||||
|
Fluent is affected by the Venezuela FX effect of $166 million. If we were to exclude this, Fluent would have been positive for $8 million. So, for Mexichem would have been positive $31 million. |
||||||||||||
| Q2 2017 | mm US$ | Q2 2018 | Q2 2018 | Q2 2018/Q2 2017 | ||||||||
| EBITDA | EBITDA | FX | Total | % Var | ||||||||
| 141 | Vinyl | 161 | (3) | 158 | 12% | |||||||
| 124 | Fluent | 180 | (2) | 178 | 44% | |||||||
| 265 | Ethylene (Vinyl + Fluent) | 341 | (5) | 336 | 27% | |||||||
| 73 | Fluor | 105 | (3) | 102 | 40% | |||||||
| - | Energy | - | - | - | ||||||||
| (11) | Eliminations / Holding | (23) | - | (23) | 109% | |||||||
| 327 | Total | 423 | (8) | 415 | 27% | |||||||
|
Fluent is affected by the Venezuela FX effect of $160 million in EBITDA. If we were to exclude this, Fluent would have been positive for $2 million. So, for Mexichem would have been positive $8 million. |
||||||||||||
| 1H17 | mm US$ | 1H18 | 1H18 | 1H18/1H17 | ||||||||
| Sales | Sales | FX | Total | % Var | ||||||||
| 1,170 | Vinyl | 1,287 | (49) | 1,238 | 6% | |||||||
| 1,472 | Fluent | 2,090 | (60) | 2,030 | 38% | |||||||
| 2,642 | Ethylene (Vinyl + Fluent) | 3,377 | (109) | 3,268 | 24% | |||||||
| 318 | Fluor | 434 | (15) | 419 | 32% | |||||||
| 1 | Energy | 1 | - | 1 | ||||||||
| (104) | Eliminations / Holding | (88) | - | (88) | -15% | |||||||
| 2,857 | Total | 3,724 | (124) | 3,600 | 26% | |||||||
|
Fluent is affected by the Venezuela FX effect of $158 million. If we were to exclude this, Fluent would have been positive for $58 million. So, for Mexichem would have been positive $122 million. |
||||||||||||
| 1H17 | mm US$ | 1H18 | 1H18 | 1H18/1H17 | ||||||||
| EBITDA | EBITDA | FX | Total | % Var | ||||||||
| 224 | Vinyl | 313 | (6) | 307 | 37% | |||||||
| 202 | Fluent | 283 | (8) | 275 | 36% | |||||||
| 426 | Ethylene (Vinyl + Fluent) | 596 | (14) | 582 | 37% | |||||||
| 123 | Fluor | 189 | (7) | 182 | 48% | |||||||
| 1 | Energy | 1 | - | 1 | ||||||||
| (21) | Eliminations / Holding | (33) | - | (33) | 57% | |||||||
| 529 | Total | 753 | (21) | 732 | 38% | |||||||
|
Fluent is affected by the Venezuela FX effect of $174 million in EBITDA. If we were to exclude this, Fluent would have been positive for $8 million. So, for Mexichem would have been positive $21 million. |
||||||||||||
ABOUT MEXICHEM
Mexichem is a global leader in plastic piping and one of the world’s largest chemical and petrochemical companies. The company contributes to global development by delivering an extended portfolio of products to high growth sectors such as infrastructure, housing, agriculture, datacom and water management, among others. With operations in 41 countries, 137 facilities worldwide and more than 22,000 employees, Mexichem has the rights to produce fluorspar in two mines in Mexico, as well as 8 training academies and 18 R&D labs. Operations are divided into three Business Groups: Fluent, Vinyl and Fluor. Mexichem has annual revenues of US$5.8 billion and has been traded on the Mexican Stock Exchange for more than 30 years. The company is member of the Mexican Stock Exchange Sustainability Index and the sustainability emerging markets index FTSE4Good.
Prospective Information
In addition to historical information, this press release contains "forward-looking" statements that reflect management's expectations for the future. The words “anticipate,” “believe,” “expect,” “hope,” “have the intention of,” “might,” “plan,” “should” and similar expressions generally indicate comments on expectations. The final results may be materially different from current expectations due to several factors, which include, but are not limited to, global and local changes in politics, the economy, business, competition, market and regulatory factors, cyclical trends in relevant sectors; as well as other factors that are highlighted under the title “Risk Factors” on the annual report submitted by Mexichem to the Mexican National Banking and Securities Commission (CNBV). The forward-looking statements included herein represent Mexichem’s views as of the date of this press release. Mexichem undertakes no obligation to revise or update publicly any forward-looking statement for any reason unless required by law.”
Mexichem has implemented a Code of Ethics that rules our relationships with our employees, clients, suppliers and general groups. Mexichem’s Code of Ethics is available for consulting in the following link: http://www.mexichem.com/Codigo_de_etica.html Additionally, according to the terms contained in the Securities Exchange Act No 42, Mexichem Audit Committee established a mechanism of contact, which allows that any person that knows the unfulfillment of operational and accounting records guidelines and lack of internal controls of the Code of Ethics, from the Company itself or from the subsidiaries that this controls, file a complaint which is anonymously guaranteed. The whistleblower program is facilitated by a third party. The telephone number in Mexico is 01-800-062-12-03. The website is http://www.ethic-line.com/mexichem and contact e-mail is mexichem@ethic-line.com. Mexichem’s Audit Committee will be notified of all complaints for immediate investigation.
INDEPENDENT ANALYSTS
EQUITY COVERAGE FROM THE LAST TWELVE MONTHS:
- Actinver
- Bank of America Merrill Lynch
- Banorte-Ixe
- Barclays
- BBVA Bancomer
- BTG Pactual
- Citigroup
- Credit Suisse
- GBM-Grupo Bursátil Mexicano
- Grupo Santander
- HSBC
- Intercam
- Invex Casa de Bolsa
- Interacciones
- Morgan Stanley
- UBS
- Vector
INTERNAL CONTROL
Mexichem’s bylaws provide the existence of the Audit and Corporate Practices Committees, intermediate corporate organs constituted in agreement with the applicable law to assist the Board of Directors to carry on their functions. Through these committees and the external auditor, it is given reasonable safety that transactions and company’s acts are executed and registered in accordance with the terms and parameters set by the Board and directives of Mexichem, the applicable law and different general guidelines, criterion and IFRS (International Financial Reporting Standards).
APPENDIX I: Mexichem SAB de CV and Subsidiaries Consolidated 2017 Pro-Forma Balance Sheet and Income Statement including Netafim Ltd. Acquisition
| Mexichem SAB de CV and Subsidiaries | ||||||||||||||||||||||||||||||||
| Consolidated Balance Sheet Pro Forma 2017 | ||||||||||||||||||||||||||||||||
| Netafim Acquisition | ||||||||||||||||||||||||||||||||
| USD in million | Pro-Forma March 2017 | Pro-Forma June 2017 | Pro-Forma September 2017 | Pro-Forma December 2017 | ||||||||||||||||||||||||||||
| Balance sheet | March 2017 reported | Netafim March 2017 IFRS | Acquisition Adjustment | March 2017 Pro-forma | June 2017 reported | Netafim June 2017 IFRS | Acquisition Adjustment | June 2017 Pro-forma | September 2017 reported | Netafim September 2017 IFRS | Acquisition Adjustment | September 2017 Pro-forma | December 2017 reported |
Netafim December 2017 IFRS |
Acquisition Adjustment |
December 2017 Pro-forma |
||||||||||||||||
| Current Assets | ||||||||||||||||||||||||||||||||
| Cash and Cash equivalents | 597 | 26 | (225) | 398 | 735 | 33 | (225) | 543 | 740 | 35 | (225) | 550 | 1,900 | 44 | (1,225) | 719 | ||||||||||||||||
| Net Account Receivable | 1,055 | 230 | 1,285 | 1,183 | 259 | 1,442 | 1,137 | 236 | 1,373 | 975 | 224 | 1,199 | ||||||||||||||||||||
| Other current assets | 1,103 | 197 | 1,300 | 1,127 | 203 | 1,330 | 1,152 | 234 | 1,386 | 1,078 | 224 | 1,302 | ||||||||||||||||||||
| Total Current Assets | 2,755 | 453 | (225) | 2,983 | 3,045 | 495 | (225) | 3,315 | 3,029 | 505 | (225) | 3,309 | 3,953 | 492 | (1,225) | 3,220 | ||||||||||||||||
| Long term assets | 5,765 | 160 | 1,243 | 7,168 | 5,791 | 165 | 1,248 | 7,204 | 5,759 | 166 | 1,248 | 7,173 | 5,807 | 163 | 1,249 | 7,219 | ||||||||||||||||
| Total Assets | 8,520 | 613 | 1,018 | 10,151 | 8,836 | 660 | 1,023 | 10,519 | 8,788 | 671 | 1,023 | 10,482 | 9,760 | 655 | 24 | 10,439 | ||||||||||||||||
| Current Liabilities | ||||||||||||||||||||||||||||||||
| Bank loans and current portion of long-term debt | 62 | 28 | 200 | 290 | 52 | 31 | 200 | 283 | 53 | 47 | 200 | 300 | 45 | 21 | 200 | 266 | ||||||||||||||||
| Suppliers and letters of credit of suppliers | 1,392 | 135 | 1,527 | 1,479 | 153 | 1,632 | 1,426 | 144 | 1,570 | 1,362 | 142 | 1,504 | ||||||||||||||||||||
| Other current liabilities | 590 | 107 | 697 | 647 | 103 | 750 | 600 | 105 | 705 | 723 | 105 | 828 | ||||||||||||||||||||
| Total Current Liabilities | 2,044 | 270 | 200 | 2,514 | 2,178 | 287 | 200 | 2,665 | 2,079 | 296 | 200 | 2,575 | 2,130 | 268 | 200 | 2,598 | ||||||||||||||||
| Bank loans and long-term debt | 2,253 | 85 | 1,000 | 3,338 | 2,270 | 89 | 1,000 | 3,359 | 2,248 | 85 | 1,000 | 3,333 | 3,210 | 85 | 3,295 | |||||||||||||||||
| Long-term other liabilities | 515 | 58 | (38) | 535 | 574 | 61 | (38) | 597 | 615 | 65 | (38) | 642 | 739 | 65 | (38) | 766 | ||||||||||||||||
| Total Liabilities | 4,812 | 413 | 1,162 | 6,387 | 5,022 | 437 | 1,162 | 6,621 | 4,942 | 446 | 1,162 | 6,550 | 6,079 | 418 | 162 | 6,659 | ||||||||||||||||
| Capital stock | 1,755 | 184 | (184) | 1,755 | 1,755 | 184 | (184) | 1,755 | 1,755 | 184 | (184) | 1,755 | 1,755 | 184 | (184) | 1,755 | ||||||||||||||||
| Retained earnings and Other comprehensive income | 1,014 | 15 | 1,029 | 1,085 | 38 | 1,123 | 1,141 | 41 | 1,182 | 1,048 | 53 | 1,101 | ||||||||||||||||||||
| Controlling interest | 2,769 | 199 | (184) | 2,784 | 2,840 | 222 | (184) | 2,878 | 2,896 | 225 | (184) | 2,937 | 2,803 | 237 | (184) | 2,856 | ||||||||||||||||
| Non-controlling interest | 939 | 1 | 40 | 980 | 974 | 1 | 45 | 1,020 | 950 | - | 45 | 995 | 878 | - | 46 | 924 | ||||||||||||||||
| Total stockholders’ equity | 3,708 | 200 | (144) | 3,764 | 3,814 | 223 | (139) | 3,898 | 3,846 | 225 | (139) | 3,932 | 3,681 | 237 | (138) | 3,780 | ||||||||||||||||
| Mexichem SAB de CV and Subsidiaries | |||||||||||||||||||||||||||||||||||
| Consolidated Income Statement Pro Forma 2017 | |||||||||||||||||||||||||||||||||||
|
Netafim Acquisition |
|||||||||||||||||||||||||||||||||||
| USD in million | Pro-Forma Q1 2017 | Pro-Forma Q2 2017 | Pro-Forma Q3 2017 | Pro-Forma Q4 2017 | Pro-Forma 2017 | ||||||||||||||||||||||||||||||
| Income Statement | Q1 2017 reported | Netafim Q1 2017 IFRS | Q1 2017 Pro-forma | Q2 2017 reported | Netafim Q2 2017 IFRS | Q2 2017 Pro-forma | January- June 2017 | Q3 2017 reported | Netafim Q3 2017 IFRS | Q3 2017 Pro-forma | January- September 2017 | Q4 2017 reported | Netafim Q4 2017 IFRS | Q4 2017 Pro-forma | 2017 reported | Netafim 2017 IFRS | 2017 Pro-forma | ||||||||||||||||||
| Net sales | 1,394 | 227 | 1,621 | 1,463 | 276 | 1,739 | 3,360 | 1,504 | 199 | 1,703 | 5,063 | 1,468 | 248 | 1,716 | 5,829 | 950 | 6,779 | ||||||||||||||||||
| Cost of sales | 1,086 | 154 | 1,240 | 1,074 | 188 | 1,262 | 2,502 | 1,130 | 139 | 1,269 | 3,771 | 1,086 | 169 | 1,255 | 4,376 | 650 | 5,026 | ||||||||||||||||||
| Gross Profit | 308 | 73 | 381 | 389 | 88 | 477 | 858 | 374 | 60 | 434 | 1,292 | 382 | 79 | 461 | 1,453 | 300 | 1,753 | ||||||||||||||||||
| Operating expenses | 187 | 47 | 234 | 165 | 51 | 216 | 450 | 173 | 46 | 219 | 669 | 219 | 59 | 278 | 744 | 203 | 947 | ||||||||||||||||||
| Operating Income | 121 | 26 | 147 | 224 | 37 | 261 | 408 | 201 | 14 | 215 | 623 | 163 | 20 | 183 | 709 | 97 | 806 | ||||||||||||||||||
| Financial cost | 44 | 6 | 50 | 75 | 5 | 80 | 130 | 44 | 6 | 50 | 180 | 13 | 5 | 18 | 176 | 22 | 198 | ||||||||||||||||||
| Equity income of associated entities | (0) | - | (0) | (0) | (0) | (1) | (1) | - | (1) | (2) | (1) | (1) | (3) | - | (3) | ||||||||||||||||||||
| Income from continued operations before income tax | 77 | 20 | 97 | 149 | 32 | 181 | 279 | 158 | 8 | 166 | 445 | 150 | 15 | 166 | 536 | 75 | 611 | ||||||||||||||||||
| Cash tax | 29 | 5 | 34 | 40 | 7 | 47 | 81 | 34 | 3 | 37 | 119 | 7 | 4 | 11 | 110 | 19 | 129 | ||||||||||||||||||
| Deferred tax | (5) | - | (5) | 23 | 23 | 18 | 28 | 28 | 47 | 20 | 20 | 66 | - | 66 | |||||||||||||||||||||
| Income Tax | 24 | 5 | 29 | 63 | 7 | 70 | 99 | 62 | 3 | 65 | 166 | 27 | 4 | 31 | 176 | 19 | 195 | ||||||||||||||||||
| Income from continued operations | 53 | 15 | 68 | 86 | 25 | 111 | 180 | 96 | 5 | 101 | 279 | 123 | 11 | 135 | 360 | 56 | 416 | ||||||||||||||||||
| Discontinued Operations | 1 | 1 | 4 | 4 | 5 | (4) | (4) | 1 | (145) | (145) | (144) | - | (144) | ||||||||||||||||||||||
| Net Consolidated Income | 54 | 15 | 69 | 90 | 25 | 115 | 185 | 92 | 5 | 97 | 280 | (22) | 11 | (10) | 216 | 56 | 272 | ||||||||||||||||||
| Minority Interest | 1 | 3 | 4 | 25 | 5 | 30 | 34 | 30 | 1 | 31 | 65 | (36) | 2 | (34) | 20 | 11 | 32 | ||||||||||||||||||
| Net Majority Income | 53 | 12 | 65 | 65 | 20 | 85 | 150 | 62 | 4 | 66 | 215 | 14 | 9 | 24 | 195 | 45 | 240 | ||||||||||||||||||
| EBITDA | 202 | 34 | 236 | 327 | 47 | 374 | 610 | 300 | 21 | 321 | 931 | 277 | 31 | 308 | 1,106 | 133 | 1,239 | ||||||||||||||||||
View source version on businesswire.com: https://www.businesswire.com/news/home/20180725006005/en/
