Waste Management Announces First Quarter Earnings
Waste Management, Inc. (NYSE: WM) today announced financial results for its quarter ended March 31, 2019. Revenues for the first quarter of 2019 were $3.70 billion compared with $3.51 billion for the same 2018 period. Net income for the quarter was $347 million, or $0.81 per diluted share, compared with $396 million, or $0.91 per diluted share, for the first quarter of 2018.(a) On an adjusted basis in the first quarter of 2019, net income was $402 million, or $0.94 per diluted share.(b) There was no adjustment to reported earnings in the first quarter of 2018.
This press release features multimedia. View the full release here: https://www.businesswire.com/news/home/20190425005465/en/
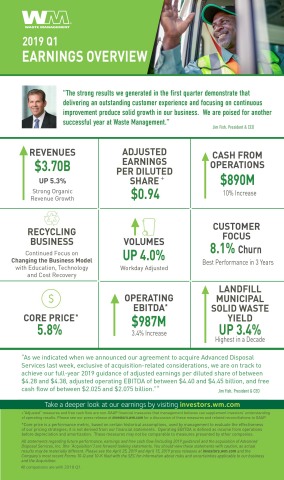
2019 Q1 Earnings Overview (Graphic: Business Wire)
The Company’s adjusted first quarter 2019 results exclude a $0.13 per diluted share charge primarily related to a non-cash impairment of an investment in a waste conversion technology business.
“The strong results we generated in the first quarter demonstrate that delivering an outstanding customer experience and focusing on continuous improvement produce solid growth in our business,” said Jim Fish, President and Chief Executive Officer of Waste Management. “In the first quarter, we saw organic revenue growth of more than 6% in our collection and disposal business, which translated into about a 7% increase in operating EBITDA in that business.(c) More importantly, this strong operational performance resulted in net cash provided by operating activities increasing by 10% when compared to 2018.
“The focus and discipline of our employees continue to drive exceptional results. That discipline is also evident in our recycling line of business, where the steps we took to improve the business increased operating EBITDA by $11 million when compared to the first quarter of 2018, despite a 28% decline in recycling commodity prices. The great start to 2019 puts us well on our way to meeting our targets for the full year.”
KEY HIGHLIGHTS FOR THE FIRST QUARTER OF 2019
Profitability
- Total Company operating EBITDA was $987 million for the first quarter of 2019, an increase of $32 million, or 3.4%, from the first quarter of 2018. The Company achieved this increase without the benefit of the expired federal natural gas fuel credits that added $28 million to operating EBITDA in the first quarter of 2018.
- Operating EBITDA in the Company’s collection and disposal business increased $76 million, or about 7.0%, in the first quarter of 2019 when compared to the first quarter of 2018.
Revenue Growth
- In the first quarter of 2019, revenue growth was driven by strong yield and volume growth in the Company’s collection and disposal business, which contributed $190 million of incremental revenue. This was partially offset by a $16 million decline in revenue from the Company’s recycling line of business on a year-over-year basis in the first quarter of 2019.
- Core price for the first quarter of 2019 was 5.8%, compared to 4.9% in the first quarter of 2018.(d)
- Internal revenue growth from yield for the collection and disposal business was 2.7% for the first quarter of 2019 versus 2.3% in the first quarter of 2018.
- Collection and disposal business internal revenue growth from volume was 3.6%, or 4.1% on a workday adjusted basis, in the first quarter of 2019. Total Company internal revenue growth from volume, which includes our recycling business, was 3.4%, or 4.0% on a workday adjusted basis, in the first quarter of 2019.
Recycling
- Average recycling commodity prices at the Company’s facilities were approximately 28% lower in the first quarter of 2019 compared to the prior year period. Recycling brokerage volumes increased 7.1% in the first quarter of 2019 on a workday adjusted basis.
- Operating EBITDA in the Company’s recycling line of business improved by $11 million from breakeven in the first quarter of 2018. The improvement was driven by the Company’s efforts to develop a sustainable business model that meets customers’ environmental needs.
Cost Management
- As a percent of revenue, total Company operating expenses were 62.2% in both the first quarter of 2019 and 2018. The Company’s focus on improving efficiency in its collection business, controlling costs and maintaining discipline in its pricing programs delivered margin expansion sufficient to offset an 80-basis point headwind from federal natural gas fuel credits received in 2018.
- As a percentage of revenue, SG&A expenses were 11.1% in the first quarter of 2019 compared to 10.6% in the first quarter of 2018. The increase was primarily related to planned investments in technology as well as litigation reserves.
Free Cash Flow & Capital Allocation
- Net cash provided by operating activities was $890 million in the first quarter of 2019, an increase of $81 million, or 10.0%, when compared to the first quarter of 2018.
- Capital expenditures were $471 million in the first quarter of 2019, a $71 million increase from the first quarter of 2018.
- Free cash flow was $431 million in the first quarter of 2019 compared to $423 million in the first quarter of 2018.(b)
- The Company paid $223 million of dividends to shareholders. Cash allocated to share repurchases of $68 million in the first quarter of 2019 was less than both prior year and the Company’s plan due to completed and contemplated acquisition spending.
- The Company spent $394 million on acquisitions during the first quarter of 2019.
Taxes
- The Company’s effective tax rate for the first quarter of 2019 was approximately 24.8%. On an adjusted basis, the Company’s tax rate was 22.2%. The Company expects its 2019 full-year adjusted tax rate to be approximately 24%.(b)
Fish concluded, “We are poised for another successful year at Waste Management. As we indicated when we announced our agreement to acquire Advanced Disposal Services last week, exclusive of acquisition-related considerations, we are on track to achieve our full-year 2019 guidance of adjusted earnings per diluted share of between $4.28 and $4.38, adjusted operating EBITDA of between $4.40 and $4.45 billion, and free cash flow of between $2.025 and $2.075 billion.” (b)
| (a) | For purposes of this press release, all references to “Net income” refer to the financial statement line item “Net income attributable to Waste Management, Inc.” | ||||||
| (b) | Adjusted earnings per diluted share, adjusted net income, adjusted tax rate, adjusted operating EBITDA and free cash flow are non-GAAP measures. Please see “Non-GAAP Financial Measures” below and the reconciliations in the accompanying schedules for more information. | ||||||
| (c) | Management defines operating EBITDA as GAAP income from operations before depreciation and amortization; this measure may not be comparable to similarly-titled measures reported by other companies. | ||||||
| (d) | Core price consists of price increases net of rollbacks and fees, excluding the Company’s fuel surcharge. It is a performance metric used by management to evaluate the effectiveness of our pricing strategies; it is not derived from our financial statements and may not be comparable to measures presented by other companies. Core price is based on certain historical assumptions, which may differ from actual results, to allow for comparability between reporting periods and to reveal trends in results over time. | ||||||
The Company will host a conference call at 10:00 AM (Eastern) today to discuss the first quarter results as well as the agreement to acquire Advanced Disposal Services, Inc., that was previously announced on April 15. Information contained within this press release will be referenced and should be considered in conjunction with the call.
The conference call will be webcast live from the Investor Relations section of Waste Management’s website www.wm.com. To access the conference call by telephone, please dial (877) 710-6139 approximately 10 minutes prior to the scheduled start of the call. If you are calling from outside of the United States or Canada, please dial (706) 643-7398. Please utilize conference ID number 4295916 when prompted by the conference call operator.
A replay of the conference call will be available on the Company’s website www.wm.com and by telephone from approximately 1:00 PM (Eastern) today through 5:00 PM (Eastern) on Thursday, May 9, 2019. To access the replay telephonically, please dial (855) 859-2056, or from outside of the United States or Canada dial (404) 537-3406, and use the replay conference ID number 4295916.
ABOUT WASTE MANAGEMENT
Waste Management, based in Houston, Texas, is the leading provider of comprehensive waste management environmental services in North America. Through its subsidiaries, the Company provides collection, transfer, disposal services, and recycling and resource recovery. It is also a leading developer, operator and owner of landfill gas-to-energy facilities in the United States. The Company’s customers include residential, commercial, industrial, and municipal customers throughout North America. To learn more information about Waste Management, visit www.wm.com or www.thinkgreen.com.
FORWARD-LOOKING STATEMENTS
The Company, from time to time, provides estimates of financial and other data, comments on expectations relating to future periods and makes statements of opinion, view or belief about current and future events. This press release contains a number of such forward-looking statements, including but not limited to statements regarding 2019 earnings per diluted share; 2019 operating EBITDA; 2019 free cash flow; 2019 tax rate; acquisition of Advanced Disposal Services, Inc.; future strong results and business success. You should view these statements with caution. They are based on the facts and circumstances known to the Company as of the date the statements are made. These forward-looking statements are subject to risks and uncertainties that could cause actual results to be materially different from those set forth in such forward-looking statements, including but not limited to, increased competition; pricing actions; failure to implement our optimization, growth, and cost savings initiatives and overall business strategy; failure to identify acquisition targets and negotiate attractive terms; failure to consummate or integrate the acquisition of Advanced Disposal Services, Inc. or other acquisitions; failure to obtain the results anticipated from the acquisition of Advanced Disposal Services, Inc. or other acquisitions; environmental and other regulations; commodity price fluctuations; international trade restrictions; disposal alternatives and waste diversion; declining waste volumes; failure to develop and protect new technology; significant environmental or other incidents resulting in liabilities and brand damage; weakness in economic conditions; failure to obtain and maintain necessary permits; labor disruptions; impairment charges; and negative outcomes of litigation or governmental proceedings. Please also see the Company’s filings with the SEC, including Part I, Item 1A of the Company’s most recently filed Annual Report on Form 10-K as updated by our subsequent quarterly reports on Form 10-Q, for additional information regarding these and other risks and uncertainties applicable to its business. The Company assumes no obligation to update any forward-looking statement, including financial estimates and forecasts, whether as a result of future events, circumstances or developments or otherwise.
NON-GAAP FINANCIAL MEASURES
To supplement its financial information, the Company, in some instances, has presented adjusted earnings per diluted share, adjusted net income, adjusted tax rate and free cash flow, and has also presented projections of adjusted earnings per diluted share, adjusted operating EBITDA, adjusted tax rate and free cash flow; these are non-GAAP financial measures, as defined in Regulation G of the Securities Exchange Act of 1934, as amended. The Company reports its financial results in compliance with GAAP but believes that also discussing non-GAAP measures provides investors with (i) additional, meaningful comparisons of current results to prior periods’ results by excluding items that the Company does not believe reflect its fundamental business performance and are not representative or indicative of its results of operations and (ii) financial measures the Company uses in the management of its business.
The Company’s projected full year 2019 earnings per diluted share, operating EBITDA and tax rate are anticipated to exclude the effects of events or circumstances in 2019 that are not representative or indicative of the Company’s results of operations. Such excluded items are not currently determinable, but may be significant, such as asset impairments and one-time items, charges, gains or losses from divestitures or litigation, or other items. Due to the uncertainty of the likelihood, amount and timing of any such items, the Company does not have information available to provide a quantitative reconciliation of adjusted projected full-year earnings per diluted share, operating EBITDA or tax rate to the comparable GAAP measures.
The Company discusses free cash flow because the Company believes that it is indicative of its ability to pay its quarterly dividends, repurchase common stock, fund acquisitions and other investments and, in the absence of refinancings, to repay its debt obligations. Free cash flow is not intended to replace “Net cash provided by operating activities,” which is the most comparable GAAP measure. The Company believes free cash flow gives investors useful insight into how the Company views its liquidity, but the use of free cash flow as a liquidity measure has material limitations because it excludes certain expenditures that are required or that the Company has committed to, such as declared dividend payments and debt service requirements. The Company defines free cash flow as net cash provided by operating activities, less capital expenditures, plus proceeds from divestitures of businesses and other assets (net of cash divested); this definition may not be comparable to similarly-titled measures reported by other companies.
The quantitative reconciliations of non-GAAP measures used herein to the most comparable GAAP measures are included in the accompanying schedules, with the exception of projected earnings per diluted share, operating EBITDA and tax rate. Non-GAAP measures should not be considered a substitute for financial measures presented in accordance with GAAP.
|
WASTE MANAGEMENT, INC. |
||||||||||
|
CONDENSED CONSOLIDATED STATEMENTS OF OPERATIONS (In Millions, Except per Share Amounts) (Unaudited) |
||||||||||
| Three Months Ended | ||||||||||
| March 31, | ||||||||||
| 2019 | 2018 | |||||||||
| Operating revenues | $ | 3,696 | $ | 3,511 | ||||||
| Costs and expenses: | ||||||||||
| Operating | 2,298 | 2,184 | ||||||||
| Selling, general and administrative | 409 | 373 | ||||||||
| Depreciation and amortization | 366 | 347 | ||||||||
| Restructuring | 2 | 2 | ||||||||
| Net gain from divestitures | — | (3 | ) | |||||||
| 3,075 | 2,903 | |||||||||
| Income from operations | 621 | 608 | ||||||||
| Other income (expense): | ||||||||||
| Interest expense, net | (96 | ) | (91 | ) | ||||||
| Equity in net losses of unconsolidated entities | (9 | ) | (7 | ) | ||||||
| Other, net | (54 | ) | 1 | |||||||
| (159 | ) | (97 | ) | |||||||
| Income before income taxes | 462 | 511 | ||||||||
| Income tax expense | 115 | 116 | ||||||||
| Consolidated net income | 347 | 395 | ||||||||
| Less: Net loss attributable to noncontrolling interests | — | (1 | ) | |||||||
| Net income attributable to Waste Management, Inc. | $ | 347 | $ | 396 | ||||||
| Basic earnings per common share | $ | 0.82 | $ | 0.91 | ||||||
| Diluted earnings per common share | $ | 0.81 | $ | 0.91 | ||||||
| Weighted average basic common shares outstanding | 424.5 | 433.3 | ||||||||
| Weighted average diluted common shares outstanding | 426.9 | 435.8 | ||||||||
|
WASTE MANAGEMENT, INC. |
||||||||
|
CONDENSED CONSOLIDATED BALANCE SHEETS (In Millions) (Unaudited) |
||||||||
| March 31, | December 31, | |||||||
| 2019 | 2018 | |||||||
| ASSETS | ||||||||
| Current assets: | ||||||||
| Cash and cash equivalents | $ | 57 | $ | 61 | ||||
| Receivables, net | 2,081 | 2,275 | ||||||
| Other | 350 | 309 | ||||||
| Total current assets | 2,488 | 2,645 | ||||||
| Property and equipment, net | 12,390 | 11,942 | ||||||
| Goodwill | 6,479 | 6,430 | ||||||
| Other intangible assets, net | 570 | 572 | ||||||
| Other | 1,446 | 1,061 | ||||||
| Total assets | $ | 23,373 | $ | 22,650 | ||||
| LIABILITIES AND EQUITY | ||||||||
| Current liabilities: | ||||||||
| Accounts payable, accrued liabilities and deferred revenues | $ | 2,569 | $ | 2,676 | ||||
| Current portion of long-term debt | 1,043 | 432 | ||||||
| Total current liabilities | 3,612 | 3,108 | ||||||
| Long-term debt, less current portion | 9,323 | 9,594 | ||||||
| Other | 4,021 | 3,672 | ||||||
| Total liabilities | 16,956 | 16,374 | ||||||
| Equity: | ||||||||
| Waste Management, Inc. stockholders’ equity | 6,415 | 6,275 | ||||||
| Noncontrolling interests | 2 | 1 | ||||||
| Total equity | 6,417 | 6,276 | ||||||
| Total liabilities and equity | $ | 23,373 | $ | 22,650 | ||||
|
WASTE MANAGEMENT, INC. |
||||||||||
|
CONDENSED CONSOLIDATED STATEMENTS OF CASH FLOWS (In Millions) (Unaudited) |
||||||||||
| Three Months Ended | ||||||||||
| March 31, | ||||||||||
| 2019 | 2018 | |||||||||
| Cash flows from operating activities: | ||||||||||
| Consolidated net income | $ | 347 | $ | 395 | ||||||
| Adjustments to reconcile consolidated net income to net cash provided by operating activities: | ||||||||||
| Depreciation and amortization | 366 | 347 | ||||||||
| Other | 123 | 42 | ||||||||
| Change in operating assets and liabilities, net of effects of acquisitions and divestitures | 54 | 25 | ||||||||
| Net cash provided by operating activities | 890 | 809 | ||||||||
| Cash flows from investing activities: | ||||||||||
| Acquisitions of businesses, net of cash acquired | (394 | ) | (246 | ) | ||||||
| Capital expenditures | (471 | ) | (400 | ) | ||||||
| Proceeds from divestitures of businesses and other assets (net of cash divested) | 12 | 14 | ||||||||
| Other, net | 53 | (5 | ) | |||||||
| Net cash used in investing activities | (800 | ) | (637 | ) | ||||||
| Cash flows from financing activities: | ||||||||||
| New borrowings | — | 61 | ||||||||
| Debt repayments | (56 | ) | (80 | ) | ||||||
| Net commercial paper borrowings | 357 | 471 | ||||||||
| Common stock repurchase program | (68 | ) | (250 | ) | ||||||
| Cash dividends | (223 | ) | (206 | ) | ||||||
| Exercise of common stock options | 25 | 23 | ||||||||
| Tax payments associated with equity-based compensation transactions | (30 | ) | (28 | ) | ||||||
| Other, net | 37 | (29 | ) | |||||||
| Net cash provided by (used in) financing activities | 42 | (38 | ) | |||||||
| Effect of exchange rate changes on cash, cash equivalents and restricted cash and cash equivalents | — | (1 | ) | |||||||
| Increase in cash, cash equivalents and restricted cash and cash equivalents | 132 | 133 | ||||||||
| Cash, cash equivalents and restricted cash and cash equivalents at beginning of period | 183 | 293 | ||||||||
| Cash, cash equivalents and restricted cash and cash equivalents at end of period | $ | 315 | $ | 426 | ||||||
|
WASTE MANAGEMENT, INC. |
||||||||||
|
SUMMARY DATA SHEET (In Millions) (Unaudited) |
||||||||||
|
Operating Revenues by Line of Business |
||||||||||
| Three Months Ended | ||||||||||
| March 31, | ||||||||||
| 2019 | 2018 | |||||||||
| Commercial | $ | 1,026 | $ | 955 | ||||||
| Residential | 640 | 614 | ||||||||
| Industrial | 680 | 637 | ||||||||
| Other | 109 | 101 | ||||||||
| Total collection | 2,455 | 2,307 | ||||||||
| Landfill | 864 | 805 | ||||||||
| Transfer | 412 | 375 | ||||||||
| Recycling | 291 | 312 | ||||||||
| Other | 431 | 427 | ||||||||
| Intercompany (a) | (757 | ) | (715 | ) | ||||||
| Total | $ | 3,696 | $ | 3,511 | ||||||
|
Internal Revenue Growth |
||||||||||||||||||
|
Period-to-Period Change for the Three Months Ended March 31, 2019 vs. 2018 |
||||||||||||||||||
| As a % of | As a % of | |||||||||||||||||
| Related | Total | |||||||||||||||||
| Amount | Business(b) | Amount | Company(c) | |||||||||||||||
| Collection and disposal | $ | 82 | 2.7 | % | ||||||||||||||
| Recycling commodities | (25 | ) | (8.4 | ) | ||||||||||||||
| Fuel surcharges and mandated fees | 5 | 3.7 | ||||||||||||||||
| Total average yield (d) | $ | 62 | 1.8 | % | ||||||||||||||
| Volume | 117 | 3.4 | ||||||||||||||||
| Internal revenue growth | 179 | 5.2 | ||||||||||||||||
| Acquisitions | 57 | 1.6 | ||||||||||||||||
| Divestitures | (42 | ) | (1.2 | ) | ||||||||||||||
| Foreign currency translation | (9 | ) | (0.3 | ) | ||||||||||||||
| Total | $ | 185 | 5.3 | % | ||||||||||||||
|
Period-to-Period Change for the Three Months Ended March 31, 2019 vs. 2018 |
|||||||
| As a % of Related Business(b) | |||||||
|
Yield |
Volume(e) | ||||||
| Commercial | 2.3 | % | 2.4 | % | |||
| Industrial | 4.2 | 3.1 | |||||
| Residential | 3.8 | (0.5 | ) | ||||
| Total collection | 3.2 | 2.1 | |||||
| MSW | 3.4 | 5.8 | |||||
| Transfer | 2.7 | 8.1 | |||||
| Total collection and disposal | 2.7 | % | 4.1 | % | |||
|
__________________________ |
||
| (a) | Intercompany revenues between lines of business are eliminated in the Condensed Consolidated Financial Statements included herein. | |
| (b) | Calculated by dividing the increase or decrease for the current year period by the prior year period’s related business revenue adjusted to exclude the impacts of divestitures for the current year period. | |
| (c) | Calculated by dividing the increase or decrease for the current year period by the prior year period’s total Company revenue adjusted to exclude the impacts of divestitures for the current year period. | |
| (d) | The amounts reported herein represent the changes in our revenue attributable to average yield for the total Company. | |
| (e) | Workday adjusted volume impact. | |
| WASTE MANAGEMENT, INC. | ||||||||||
| SUMMARY DATA SHEET | ||||||||||
| (In Millions) | ||||||||||
| (Unaudited) | ||||||||||
| Free Cash Flow Analysis (a) | ||||||||||
| Three Months Ended | ||||||||||
| March 31, | ||||||||||
| 2019 | 2018 | |||||||||
| Net cash provided by operating activities | $ | 890 | $ | 809 | ||||||
| Capital expenditures | (471 | ) | (400 | ) | ||||||
| Proceeds from divestitures of businesses | ||||||||||
| and other assets (net of cash divested) | 12 | 14 | ||||||||
| Free cash flow | $ | 431 | $ | 423 | ||||||
| Three Months Ended | ||||||||||
| March 31, | ||||||||||
| 2019 | 2018 | |||||||||
| Supplemental Data | ||||||||||
| Internalization of waste, based on disposal costs | 66.2 | % | 65.2 | % | ||||||
| Landfill amortizable tons (in millions) | 27.9 | 26.2 | ||||||||
| Acquisition Summary (b) | ||||||||||
| Gross annualized revenue acquired | 105 | 158 | ||||||||
| Total consideration, net of cash acquired | 395 | 246 | ||||||||
| Cash paid for acquisitions consummated during the period, | ||||||||||
| net of cash acquired | 389 | 238 | ||||||||
| Cash paid for acquisitions including contingent consideration | ||||||||||
| and other items from prior periods, net of cash acquired | 394 | 248 | ||||||||
| Amortization, Accretion and Other Expenses for Landfills: | Three Months Ended | |||||||||
| March 31, | ||||||||||
| 2019 | 2018 | |||||||||
| Landfill amortization expense | ||||||||||
| Cost basis of landfill assets | $ | 110.0 | $ | 100.0 | ||||||
| Asset retirement costs | 16.8 | 19.6 | ||||||||
| Total landfill amortization expense | 126.8 | 119.6 | ||||||||
| Accretion and other related expense | 24.5 | 24.2 | ||||||||
| Landfill amortization, accretion and other related expense | $ | 151.3 | $ | 143.8 | ||||||
| (a) | The summary of free cash flow has been prepared to highlight and facilitate understanding of the principal cash flow elements. Free cash flow is not a measure of financial performance under generally accepted accounting principles and is not intended to replace the consolidated statement of cash flows that was prepared in accordance with generally accepted accounting principles. | |
| (b) | Represents amounts associated with business acquisitions consummated during the applicable period except where noted. |
| WASTE MANAGEMENT, INC. | |||||||||||||||||||||||
| RECONCILIATION OF CERTAIN NON-GAAP MEASURES | |||||||||||||||||||||||
| (In Millions, Except Per Share Amounts) | |||||||||||||||||||||||
| (Unaudited) | |||||||||||||||||||||||
|
Three Months Ended
March 31, 2019 |
|||||||||||||||||||||||
|
Income from |
Pre-tax |
Tax |
Net |
Diluted Per |
|||||||||||||||||||
| As reported amounts | $ | 621 | $ | 462 | $ | 115 | $ | 347 | $ | 0.81 | |||||||||||||
| Adjustments: | |||||||||||||||||||||||
| Impairment of an investment and other | - | 55 | - | 55 | 0.13 | ||||||||||||||||||
| As adjusted amounts | $ | 621 | $ | 517 | $ | 115 | (b) | $ | 402 | $ | 0.94 | ||||||||||||
| 2019 Projected Free Cash Flow Reconciliation (c) | |||||||||||||||||||||||
| Scenario 1 | Scenario 2 | ||||||||||||||||||||||
| Net cash provided by operating activities | $ | 3,625 | $ | 3,725 | |||||||||||||||||||
| Capital expenditures | (1,650 | ) | (1,750 | ) | |||||||||||||||||||
| Proceeds from divestitures of businesses and | |||||||||||||||||||||||
| other assets (net of cash divested) | 50 | 100 | |||||||||||||||||||||
| Free cash flow | $ | 2,025 | $ | 2,075 | |||||||||||||||||||
|
________________________________________________ |
||
| (a) | For purposes of this press release table, all references to "Net income" refer to the financial statement line item "Net income attributable to Waste Management, Inc.". | |
| (b) | The Company calculates its effective tax rate based on actual dollars. When the effective tax rate is calculated by dividing the Tax Expense amount in the table above by the Pre-tax Income amount, differences occur due to rounding, as these items have been rounded in millions. The first quarter 2019 adjusted effective tax rate was 22.2%. | |
| (c) | The reconciliation includes two scenarios that illustrate our projected free cash flow range for 2019. The amounts used in the reconciliation are subject to many variables, some of which are not under our control and, therefore, are not necessarily indicative of actual results. | |
View source version on businesswire.com: https://www.businesswire.com/news/home/20190425005465/en/

