FinVolution Group (formerly known as PPDAI Group Inc.) Reports Third Quarter 2019 Unaudited Financial Results
SHANGHAI, Nov. 19, 2019 /PRNewswire/ - FinVolution Group, formerly known as PPDAI Group Inc., ("FinVolution," or the "Company") (NYSE: PPDF), a leading online consumer finance marketplace in China, today announced its unaudited financial results for the third quarter ended September 30, 2019.
              As of


             September 30,              June

          30,

     September 30,
                                                                            2018                               2019                  2019


       Cumulative registered users[1] ('000)                             83,949                             99,022               102,847


       Cumulative number of borrowers[2] ('000)                          13,440                             16,528                17,445


                                                         For Three Months Ended

             YoY Change


                                                        September
               30,     September
             30,
                                                                            2018                               2019


       Number of unique borrowers[3] ('000)                               2,750                              3,537                 28.6%


       Loan origination volume[4](RMB, million)                          14,771                             24,579                 66.4%


       Repeat borrowing rate[5] (%)                                      69.8%                             79.4%                13.8%


       Average loan size[6] (RMB)                                         3,396                              3,156                 -7.1%

    ---
Third Quarter 2019 Financial and Operational Highlights
    --  Operating revenues increased by 35.0% to RMB1,512.4 million (US$211.6
        million) in the third quarter of 2019, from RMB1,120.4 million in the
        same period of 2018.
    --  Loan facilitation service fees increased by 26.3% to RMB893.6 million
        (US$125.0 million) in the third quarter of 2019, from RMB707.7 million
        in the same period of 2018.
    --  Operating income was RMB648.9 million (US$90.8 million) for the third
        quarter of 2019, representing an increase of 32.3% from RMB490.6 million
        in the same period of 2018.
    --  Non-GAAP adjusted operating income, which excludes share-based
        compensation expenses before tax, was RMB657.8 million (US$92.0 million)
        for the third quarter of 2019, representing an increase of 44.8% from
        RMB454.4 million in the same period of 2018.
    --  Cumulative registered users([1]) reached approximately 102.8 million as
        of September 30, 2019.
    --  Cumulative number of borrowers([2]) was approximately 17.4 million as of
        September 30, 2019.
    --  Number of unique borrowers([3]) was approximately 3.5 million for the
        third quarter of 2019, representing an increase of 28.6% from the same
        period of 2018.
    --  Loan origination volume([4]) was approximately RMB24.6 billion for the
        third quarter of 2019, representing an increase of 66.4% from the same
        period of 2018.
    --  The proportion of total loan origination volume facilitated by
        institutional funding partners increased to approximately 75.1% for the
        third quarter of 2019 from 44.8% for the second quarter of 2019.
    --  Average loan tenure([7]) was 8.2 months for the third quarter of 2019.
                [1] On a cumulative basis, number of users registered on our platform as of September 30, 2019


                [2] On a cumulative basis, number of borrowers whose loans were funded on or prior to September 30, 2019.


                [3] Represents the total number of borrowers whose loans on our platform were facilitated during the period
      presented.


                [4] Represents the loan origination volume facilitated during the period presented.


                [5] Represents the percentage of loan volume generated by repeat borrowers who have successfully borrowed
      on our platform before.


                [6] Represents the average loan size on our platform during the period presented.


                [7] Represents the average loan tenure period on our platform during the period presented.
Mr. Jun Zhang, Chairman and Co-Chief Executive Officer of FinVolution, commented, "We are pleased to deliver solid results and continued transition of our funding sources towards institutions. For the quarter, total loan origination volume increased by 66.4% year-over-year to RMB24.6 billion, operating revenue increased by 35.0% year-over-year to RMB1.5 billion, and the proportion of loan originations facilitated by institutional partners further increased to over 75.1%.
Both the demand and outlook of our institutional partners remain solid as we continue to strategically expand our business. As the business evolves with the dynamics of the industry, we continue to transition our investor base from individuals to institutions. Meanwhile, we are repositioning our brand to better align with the current business model. In our most recent Annual General Meeting, our shareholders approved our Board's proposal to change our corporate name and ticker symbol. Looking ahead, we are committed to broadening our spectrum of technology capabilities in order to service our borrowers and deepen our cooperation with institutional partners."
Mr. Feng Zhang, Co-Chief Executive Officer of FinVolution, added, "We have undergone a significant transition - in a little more than 12 months, our platform went from being mainly facilitated by individual investors to predominantly our institutional partners. During this transition period, we have sustained consistent performance as highlighted by our continuous loan volume growth, relatively stable delinquency trends and healthy profitability. Our transition has been rapid and smooth, and demonstrates our strong execution and management capability.
Looking forward, the consumer finance market in China is vast and remains under-penetrated. We are confident that with our experience and capabilities, FinVolution Group is well-positioned to connect and facilitate individual's financing needs with banks and financial institutions."
Mr. Simon Ho, Chief Financial Officer of FinVolution, commented, "We are pleased to report another solid quarter. Our non-GAAP adjusted operating income increased year over year by a solid 44.8% and non-GAAP operating margin was at a healthy level of 43.5%. Our balance sheet remained strong with approximately RMB2.2 billion of cash and short-term liquidity.
"Notably, our quality assurance fund remains sufficiently funded with a total balance of RMB6.0 billion, equivalent to 21.0% of the total outstanding loans and interest with quality assurance. With healthy loan origination demand for the foreseeable future, an innovative technology-driven platform matching requirements of different institutional partners, FinVolution remains the leading online consumer finance marketplace in China."
Third Quarter 2019 Financial Results
Operating revenues for the third quarter of 2019 increased by 35.0% to RMB1,512.4 million (US$211.6 million) from RMB1,120.4 million in the same period of 2018, primarily due to the increase in loan facilitation service fees, post-facilitation service fees and net interest income from loans invested mainly through trusts.
Loan facilitation service fees increased by 26.3% to RMB893.6 million (US$125.0 million) for the third quarter of 2019 from RMB707.7 million in the same period of 2018, primarily due to the increase in loan origination volume.
Post-facilitation service fees increased by 25.3% to RMB300.7 million (US$42.1 million) for the third quarter of 2019 from RMB239.9 million in the same period of 2018, primarily due to the increase in loan origination volume and the rolling impact of deferred transaction fees.
Net interest income and loan provision losses were an income of RMB264.9 million (US$37.1 million) for the third quarter of 2019, compared to an income of RMB16.1 million in the same period of 2018, primarily due to increased interest income from the expansion in the outstanding loan balances of consolidated trusts.
Other revenue decreased by 52.5% to RMB53.2 million (US$7.4 million) for the third quarter of 2019 from RMB112.1 million in the same period of 2018, primarily due to a decrease in management fees from investment programs that invest in loans protected by the quality assurance fund.
Origination and servicing expenses increased by 46.8% to RMB332.1 million (US$46.5 million) for the third quarter of 2019 from RMB226.2 million in the same period of 2018, primarily due to an increase in fees paid to third party providers for loan collection services and an increase in salaries and benefits.
Sales and marketing expenses increased by 24.2% to RMB229.2 million (US$32.1 million) for the third quarter of 2019 from RMB184.5 million in the same period of 2018, primarily due to the increase in online customer acquisition expenses.
General and administrative expenses increased by 24.2% to RMB124.8 million (US$17.5 million) for the third quarter of 2019 from RMB100.5 million in the same period of 2018, primarily due to an increase in fees paid to third parties for trust management. General and administrative expenses for the period included share-based compensation of RMB8.9 million (US$1.2 million).
Research and development expenses increased by 31.7% to RMB108.2 million (US$15.1 million) for the third quarter of 2019 from RMB82.1 million in the same period of 2018, primarily due to increased investments in technology.
Provision for doubtful accounts was RMB69.2 million (US$9.7 million) for the third quarter of 2019, compared with RMB36.4 million in the same period of 2018 due to the increase in loan origination volume.
Operating income increased by 32.3% to RMB648.9 million (US$90.8 million) for the third quarter of 2019 from RMB490.6 million in the same period of 2018.
Non-GAAP adjusted operating income, which excludes share-based compensation expenses before tax, was RMB657.8 million (US$92.0 million) for the third quarter of 2019, representing an increase of 44.8% from RMB454.4 million in the same period of 2018.
Other income was RMB80.2 million (US$11.2 million) for the third quarter of 2019, compared with other income of RMB251.1 million in the same period of 2018. Other income primarily consisted of (1) a gain of RMB34.3 million (US$4.8million) from the quality assurance fund, (2) a realized gain of RMB37.2 million (US$5.2 million), (3) a loss of RMB43.5 million (US$6.1 million) from the fair value change of financial guarantee derivatives, (4) other income of RMB52.1 million (US$7.3 million). The Company re-evaluates the expected default rate at each balance sheet date to reflect the views of market participants of future defaults of the Company's loan portfolio based on the latest market changes. For the third quarter of 2019, RMB21.1 billion of loans facilitated on the Company's platform had quality assurance protection.
Income tax expenses increased by 41.8% to RMB130.7 million (US$18.3 million) for the third quarter of 2019 from RMB92.2 million in the same period of 2018 as a result of the increase in proportion of loan volume facilitated by institutional funding, which has a higher effective tax rate.
Net profit decreased by 7.9% to RMB598.5 million (US$83.7 million) for the third quarter of 2019, from RMB649.5 million in the same period of 2018.
Net profit attributable to ordinary shareholders of the Company decreased by 7.9% to RMB597.9 million (US$83.7 million) for the third quarter of 2019, from RMB649.3 million in the same period of 2018.
As of September 30, 2019, the Company had cash and cash equivalents of RMB1,762.7 million (US$246.6 million) and short-term investments mainly in wealth management products of RMB419.3 million (US$58.7 million).
The total balance of the quality assurance fund, which includes restricted cash of RMB3,074.1 million (US$430.1 million) and the quality assurance fund receivable of RMB2,901.7 million (US$406.0 million), was equivalent to 21.0% of the total outstanding loans and interest with quality assurance.
The following table provides the delinquency rates for all outstanding loans on the Company's platform as of the respective dates indicated.
                  As of      15-29      30-59      60-89      90-119      120-149      150-179
                        days       days       days       days        days         days


     March 31, 2017          0.57%      0.95%      0.79%       0.59%        0.54%        0.51%


     June 30, 2017           0.86%      1.11%      0.79%       0.51%        0.55%        0.52%


     September 30,
      2017                   0.89%      1.40%      1.15%       1.02%        0.79%        0.60%


     December 31, 2017       2.27%      2.21%      1.72%       1.63%        1.36%        1.20%


     March 31, 2018          0.87%      2.11%      2.43%       3.83%        2.29%        1.89%


     June 30, 2018           0.83%      1.21%      1.05%       0.98%        1.60%        2.03%


     September 30,
      2018                   1.03%      1.77%      1.49%       1.29%        1.06%        1.02%


     December 31, 2018       0.92%      1.63%      1.41%       1.45%        1.44%        1.34%


     March 31, 2019          0.80%      1.61%      1.45%       1.29%        1.31%        1.20%


     June 30, 2019           0.86%      1.42%      1.37%       1.19%        1.26%        1.21%


     September 30,
      2019                   0.90%      1.50%      1.35%       1.31%        1.17%        1.20%
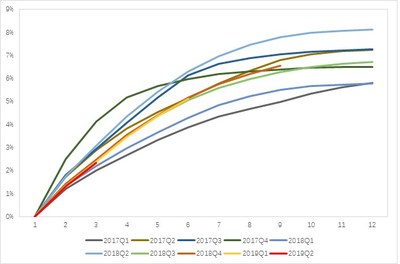
The following chart and table display the historical cumulative 30-day plus past due delinquency rates by loan origination vintage for all loan products facilitated through the Company's online marketplace.
Click here to view the chart.
           Month on Book


                   Vintage   2nd   3rd   4th       5th                 6th   7th   8th   9th  10th  11th  12th


     2017Q1 . . . .       1.20% 2.01% 2.68%     3.32%               3.87% 4.33% 4.68% 4.98% 5.33% 5.61% 5.80%


     2017Q2 . . . .       1.72% 2.89% 3.81%     4.55%               5.14% 5.78% 6.32% 6.79% 7.05% 7.19% 7.24%


     2017Q3 . . . .       1.82% 2.93% 4.08%     5.16%               6.13% 6.64% 6.88% 7.04% 7.16% 7.22% 7.26%


     2017Q4 . . . .       2.51% 4.12% 5.16%     5.68%               5.97% 6.18% 6.29% 6.39% 6.47% 6.50% 6.50%


     2018Q1 . . . .       1.35% 2.18% 2.97%     3.65%               4.30% 4.85% 5.22% 5.50% 5.66% 5.74% 5.77%


     2018Q2 . . . .       1.75% 3.08% 4.35%     5.43%               6.31% 6.97% 7.45% 7.79% 7.99% 8.08% 8.13%


     2018Q3......         1.42% 2.48% 3.50%     4.36%               5.07% 5.58% 5.96% 6.27% 6.49% 6.64% 6.72%


     2018Q4. . . .        1.42% 2.48% 3.54%     4.41%               5.17% 5.76% 6.19% 6.54%


     2019Q1......         1.33% 2.38% 3.45%     4.36%               5.13%


     2019Q2......         1.33% 2.34%
Business Outlook
The Company currently expects total loan origination volume to be in the range of RMB16 billion to RMB19 billion for the fourth quarter of 2019. This is within the Company's previous guidance for loan originations facilitated by institutional partners to be in the range of RMB32 billion to RMB38 billion for the second half of 2019.
The Company plans to discontinue its online information intermediary business between individual borrowers and individual investors, that is the part of FinVolution's business in which loans on the Company's platform are facilitated by individual investors. The Company will continue its strategy of expanding loan facilitations on the platform by institutional funding partners. In the third quarter of 2019, loan originations facilitated by institutional partners increased to 75.1% of total loan origination volume, and the Company expects this proportion to further increase in the fourth quarter of 2019. As the Company's business model of loan facilitation by institutional funding partners has a relatively short operating history, the Company's operations and future growth may be subject to uncertainty.
The above outlook is based on current market conditions and reflects the Company's preliminary expectations as to market conditions, its regulatory and operating environment, as well as customer demand, all of which are subject to change.
Conference Call
The Company's management will host an earnings conference call at 8:00 AM U.S. Eastern Time on November 19, 2019 (9:00 PM Beijing/Hong Kong time on November 19, 2019).
Dial-in details for the earnings conference call are as follows:
               United States (toll free):                  1-888-346-8982


              International:                              1-412-902-4272


               Hong Kong, China (toll free):               800-905-945


              Hong Kong, China:                           852-3018-4992


              Mainland China:                             400-120-1203
Participants should dial-in at least 5 minutes before the scheduled start time and ask to be connected to the call for "PPDAI Group."
Additionally, a live and archived webcast of the conference call will be available on the Company's investor relations website at http://ir.ppdai.com.
A replay of the conference call will be accessible approximately one hour after the conclusion of the live call until November 26, 2019, by dialing the following telephone numbers:
               United States (toll free):
              1-877-344-7529


              International:
              1-412-317-0088


              Replay Access Code:                             10136591
About FinVolution Group.
FinVolution is a leading online consumer finance platform in China connecting underserved individual borrowers with financial institutions. Established in 2007, the Company is a pioneer in China's online consumer finance industry and has developed strong innovative technologies and has accumulated in-depth experience in the core areas of credit risk assessment, fraud detection, big data and artificial intelligence. The Company's platform, empowered by proprietary cutting-edge technologies, features a highly automated loan transaction process, which enables a superior user experience. As of September 30, 2019, the Company had over 102 million cumulative registered users.
For more information, please visit http://ir.ppdai.com.
Use of Non-GAAP Financial Measures
We use Non-GAAP operating income, a Non-GAAP financial measure, in evaluating our operating results and for financial and operational decision-making purposes. We believe that adjusted operating income help identify underlying trends in our business by excluding the impact of share-based compensation expenses and expected discretionary measures. We believe that adjusted operating income provide useful information about our operating results, enhance the overall understanding of our past performance and future prospects and allow for greater visibility with respect to key metrics used by our management in its financial and operational decision-making.
Non-GAAP adjusted operating income is not defined under U.S. GAAP and is not presented in accordance with U.S. GAAP. This Non-GAAP financial measure has limitations as analytical tool, and when assessing our operating performance, cash flows or our liquidity, investors should not consider it in isolation, or as a substitute for net (loss)/income, cash flows provided by operating activities or other consolidated statements of operation and cash flow data prepared in accordance with U.S. GAAP. The Company encourages investors and others to review our financial information in its entirety and not rely on a single financial measure.
For more information on this Non-GAAP financial measure, please see the table captioned "Reconciliations of GAAP and Non-GAAP results" set forth at the end of this press release.
Exchange Rate Information
This announcement contains translations of certain RMB amounts into U.S. dollars at a specified rate solely for the convenience of the reader. Unless otherwise noted, all translations from RMB to U.S. dollars are made at a rate of RMB7.1477 to US$1.00, the rate in effect as of September 30, 2019 as certified for customs purposes by the Federal Reserve Bank of New York.
Safe Harbor Statement
This press release contains forward-looking statements. These statements constitute "forward-looking" statements within the meaning of Section 21E of the Securities Exchange Act of 1934, as amended, and as defined in the U.S. Private Securities Litigation Reform Act of 1995. These forward-looking statements can be identified by terminology such as "will," "expects," "anticipates," "future," "intends," "plans," "believes," "estimates," "target," "confident" and similar statements. Such statements are based upon management's current expectations and current market and operating conditions, and relate to events that involve known or unknown risks, uncertainties and other factors, all of which are difficult to predict and many of which are beyond the Company's control. Forward-looking statements involve risks, uncertainties and other factors that could cause actual results to differ materially from those contained in any such statements. Potential risks and uncertainties include, but are not limited to, uncertainties as to the Company's ability to attract and retain borrowers and investors on its marketplace, its ability to increase volume of loans facilitated through the Company's marketplace, its ability to introduce new loan products and platform enhancements, its ability to compete effectively, laws, regulations and governmental policies relating to the online consumer finance industry in China, general economic conditions in China, and the Company's ability to meet the standards necessary to maintain listing of its ADSs on the NYSE, including its ability to cure any non-compliance with the NYSE's continued listing criteria. Further information regarding these and other risks, uncertainties or factors is included in the Company's filings with the U.S. Securities and Exchange Commission. All information provided in this press release is as of the date of this press release, and FinVolution does not undertake any obligation to update any forward-looking statement as a result of new information, future events or otherwise, except as required under applicable law.
For investor and media inquiries, please contact:
In China:
FinVolution Group
Head of Investor Relations
Jimmy Tan
Tel: +86 (21) 8030 3200-8601
E-mail: ir@ppdai.com
Sylvie Deng
Tel: +86 (21) 8030 3200-8601
E-mail: ir@ppdai.com
The Piacente Group, Inc.
Jenny Cai
Tel: +86 (10) 6508-0677
E-mail: paipaidai@tpg-ir.com
In the United States:
The Piacente Group, Inc.
Brandi Piacente
Tel: +1-212-481-2050
E-mail: paipaidai@tpg-ir.com
FinVolution Group
UNAUDITED INTERIM CONDENSED CONSOLIDATED BALANCE SHEETS
(All amounts in thousands, except share data, or otherwise noted)
As of December 31, As of September 30,
2018 2019
RMB
RMB
USD
Assets
Cash and cash equivalents 1,616,164 1,762,727 246,615
Restricted cash 3,677,557 6,000,323 839,476
Short-term investments 1,694,660 419,287 58,660
Investments 167,501 251,485 35,184
Quality assurance fund receivable 2,064,366 2,901,703 405,963
Intangible assets 68,880 64,280 8,993
Property, equipment and software, net 144,002 141,306 19,769
Loans receivable, net of provision for loan losses 2,331,108 4,548,985 636,426
Accounts receivable 812,042 1,101,462 154,100
Deferred tax assets 122,763 134,794 18,858
Financial guarantee derivative assets 56,287 4,606 643
Contract assets 112,103 38,142 5,336
Right of use assets - 100,363 14,041
Prepaid expenses and other assets 224,623 1,969,262 275,509
Goodwill 50,411 50,411 7,053
Total assets 13,142,467 19,489,136 2,726,626
Liabilities and Shareholders' Equity
Payable to platform customers 905,034 2,394,013 334,935
Quality assurance payable 3,819,379 5,373,640 751,800
Payroll and welfare payable 188,254 193,342 27,050
Taxes payable 225,101 190,129 26,600
Short-term borrowings 25,000 25,000 3,498
Funds payable to investors of consolidated trusts 1,505,909 2,970,895 415,644
Contract liability 165,469 92,430 12,931
Deferred tax liabilities 100,064 112,070 15,679
Accrued expenses and other liabilities 222,519 413,498 57,851
Leasing liabilities - 91,348 12,780
Total liabilities 7,156,729 11,856,365 1,658,768
Commitments and contingencies
FinVolution Group Shareholders' equity
Ordinary shares 102 103 14
Additional paid-in capital 5,896,017 5,630,852 787,785
Treasury stock (332,121) (12,314) (1,723)
Statutory reserves 256,006 256,006 35,817
Accumulated other comprehensive income 58,210 79,276 11,089
Retained Earnings 45,668 1,616,526 226,157
Total FinVolution Group shareholders' equity 5,923,882 7,570,449 1,059,139
Non-controlling interest 61,856 62,322 8,719
Total shareholders' equity 5,985,738 7,632,771 1,067,858
Total liabilities and shareholders' equity 13,142,467 19,489,136 2,726,626
(1) We have adopted ASU No. 2016-02, "Leases," beginning January 1, 2019 and elected to utilize a modified
retrospective approach which allowed us to initially apply the new lease standard at the adoption date and
recognize a cumulative effect adjustment to the opening balance of retained earnings of 2019, with no adjustments
to prior periods presented. No cumulative effect adjustment to the opening balance of retained earnings were
made. The adoption of the new guidance did not have a material effect on our results of operations, financial
condition or liquidity.
FinVolution Group
UNAUDITED INTERIM CONDENSED CONSOLIDATED STATEMENTS OF COMPREHENSIVE INCOME
(All amounts in thousands, except share data, or otherwise noted)
For the Three Months Ended September 30, For the Nine Months Ended September 30,
2018 2019 2018 2019
RMB
RMB
USD
RMB
RMB
USD
Operating revenues:
Loan facilitation service fees 707,738 893,614 125,021 2,081,807 2,771,979 387,814
Post-facilitation service fees 239,880 300,671 42,065 672,910 924,542 129,348
Net interest income and loan 16,096 264,915 37,063 72,769 592,969 82,959
provision losses
Other Revenue 112,092 53,229 7,447 269,113 243,542 34,073
Changes in expected discretionary payment 44,572
to IRF investors
44,572
Total Operating revenues 1,120,378 1,512,429 211,596 3,141,171 4,533,032 634,194
Operating expenses:
Origination and servicing expenses (226,227) (332,078) (46,459) (707,976) (903,053) (126,342)
Sales and marketing expenses (184,481) (229,190) (32,065) (529,853) (588,585) (82,346)
General and administrative expenses (100,507) (124,806) (17,461) (254,849) (334,630) (46,816)
Research and development expenses (82,145) (108,221) (15,141) (234,837) (297,504) (41,622)
Provision for doubtful accounts receivables (36,411) (69,185) (9,679) (53,631) (197,895) (27,687)
Total operating expenses (629,771) (863,480) (120,805) (1,781,146) (2,321,667) (324,813)
Other income (expenses)
Gain from quality assurance fund 276,593 34,321 4,802 487,425 91,331 12,778
Realized gain (loss) from financial guarantee (28,108) (175,215) 29,695 4,154
derivatives
37,235 5,209
Fair value change of financial guarantee (6,796) 261,277 (51,681) (7,231)
derivatives
(43,474) (6,082)
Other income, net 9,395 52,147 7,296 106,171 106,200 14,858
Profit before income tax expense 741,691 729,178 102,016 2,039,683 2,386,910 333,940
Income tax expenses (92,189) (130,718) (18,288) (344,823) (424,870) (59,442)
Net profit 649,502 598,460 83,728 1,694,860 1,962,040 274,498
Net profit (loss) attributable to non-controlling 207 (40)
interest shareholders
577 81 466 65
Net profit attributable to FinVolution Group 649,295 597,883 83,647 1,694,900 1,961,574 274,433
Foreign currency translation adjustment, net 36,625 21,335 2,985 47,080 21,066 2,947
of nil tax
Total comprehensive income attributable 685,920 619,218 86,632 1,741,980 1,982,640 277,380
to FinVolution Group
Weighted average number of ordinary shares
used in computing net income per share
Basic 1,483,389,904 1,553,399,525 1,553,399,525 1,502,800,121 1,521,577,804 1,521,577,804
Diluted 1,571,175,958 1,579,642,133 1,579,642,133 1,611,816,214 1,565,427,361 1,565,427,361
Income per share -Basic 0.4377 0.3849 0.0538 1.1278 1.2892 0.1804
Income per ADS-Basic 2.1886 1.9244 0.2692 5.6391 6.4459 0.9018
Income per share -Diluted 0.4133 0.3785 0.0530 1.0515 1.2531 0.1753
Income per ADS-Diluted 2.0663 1.8925 0.2648 5.2577 6.2653 0.8765
                FinVolution Group


       UNAUDITED INTERIM CONDENSED CONSOLIDATED STATEMENTS OF CASH FLOWS


        (All amounts in thousands, except share data, or otherwise noted)


                                                                       Three Months Ended September 30,                                    Nine Months Ended September 30,

                                                                                                                                             ---

                                                                         2018                                  2019                               2018                         2019


        RMB                                 RMB
      USD                                RMB          RMB         USD


            Net cash provided by operating                         1,126,389                    1,515,746                            212,061                    1,366,683     2,609,065      365,022
      activities


            Net cash provided by (used in)                       (1,117,253)                      28,870                              4,040                    (627,835)  (1,094,495)   (153,126)
      investing activities


            Net cash provided by financing                           263,482                      285,077                             39,883                       89,256       937,102      131,106
      activities


            Effect of exchange rate changes on cash                   36,993                       16,505                              2,309                       44,853        17,657        2,470
      and cash equivalents


            Net increase in cash, cash equivalent and                309,611                    1,846,198                            258,293                      872,957     2,469,329      345,472
      restricted cash


            Cash, cash equivalent and restricted cash              4,847,050                    5,916,852                            827,798                    4,283,704     5,293,721      740,619
      at beginning of period


            Cash, cash equivalent and restricted cash              5,156,661                    7,763,050                          1,086,091                    5,156,661     7,763,050    1,086,091
      at end of period
                FinVolution Group


                UNAUDITED Reconciliation of GAAP And Non-GAAP Results


                 (All amounts in thousands, except share data, or otherwise noted)


                                                                 For the Three Months Ended September 30,                           For the Nine Months Ended September 30,

                                                                                                                                                                        ---

                                                                                                     2018                                                               2019            2018               2019


                RMB

                RMB

         USD

          RMB

          RMB

          USD


                Total Operating revenues                                              1,120,378                                                          1,512,429         211,596          3,141,171           4,533,032            634,194


            Less: total operating expenses                                                     (629,771)                                                         (863,480)      (120,805)       (1,781,146)        (2,321,667)         (324,813)


                Operating Income                                                        490,607                                                            648,949          90,791          1,360,025           2,211,365            309,381


            Less: Change in expected discretionary payment to
      IRF investors
                                                                                                 (44,572)                                                                                           (44,572)


            Add: share-based compensation expenses                                                 8,321                                                              8,890           1,244             40,764              32,827              4,593


                Non-GAAP adjusted operating income                                      454,356                                                            657,839          92,035          1,356,217           2,244,192            313,974


                Operating Margin                                                          43.8%                                                             42.9%          42.9%             43.3%              48.8%             48.8%


                Non-GAAP operating margin                                                 40.6%                                                             43.5%          43.5%             43.2%              49.5%             49.5%
View original content:http://www.prnewswire.com/news-releases/finvolution-group-formerly-known-as-ppdai-group-inc-reports-third-quarter-2019-unaudited-financial-results-300960710.html
SOURCE PPDAI Group Inc.
