CEVA, Inc. Announces First Quarter 2019 Financial Results
MOUNTAIN VIEW, Calif., May 6, 2019 /PRNewswire/ -- CEVA, Inc. (NASDAQ: CEVA), the leading licensor of signal processing platforms and artificial intelligence processors for smarter, connected devices, announced today its financial results for the first quarter ended March 31, 2019.
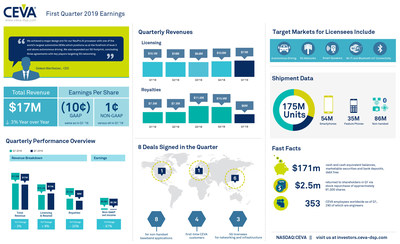
https://mma.prnewswire.com/media/881919/CEVA_Q1_2019_infographic.jpg
Total revenue for the first quarter of 2019 was $17.0 million, a 3% decrease compared to $17.6 million reported for the first quarter of 2018. First quarter 2019 licensing and related revenue was $11.0 million, an increase of 9% when compared to $10.1 million reported for the same quarter a year ago. Royalty revenue for the first quarter of 2019 was $6.0 million, a decrease of 20% when compared to $7.5 million reported for the first quarter of 2018.
Gideon Wertheizer, CEO of CEVA, stated: "Our team executed another strong licensing quarter, including multiple strategic agreements signed. We achieved a major design win for our NeuPro AI processor with one of the world's largest automotive OEMs which positions us at the forefront of level 3 and above autonomous driving. We also expanded our 5G footprint, concluding three agreements with key players targeting 5G networking. Our royalty revenue from handsets suffered substantial headwinds due to excess channel inventory. Our royalties from our non-handset baseband customer base continued to expand, delivering 22% year-over-year growth."
Of the eight license agreements completed during the quarter, three were for smart sensing products and five were for connectivity products. All of the licensing agreements signed during the quarter were for non-handset baseband applications and four were with first-time customers of CEVA. Customers' target markets include AI for autonomous cars, 5G for base station RAN, mmWave small cells and cellular V2X, Bluetooth earbuds, smart speakers and a range of IoT devices. Geographically, three of the deals signed were in China, one was in the U.S., one was in Europe and three were in the APAC region, including Japan.
GAAP net loss for the first quarter of 2019 was $2.3 million, as compared to a net loss of $2.2 million reported for the same period in 2018. GAAP diluted loss per share for both first quarters of 2019 and 2018 was ($0.10).
Non-GAAP net income and diluted earnings per share for the first quarter of 2019 were $0.3 million and $0.01, respectively, down from the $0.8 million and $0.04 reported for the first quarter of 2018. Non-GAAP net income and diluted earnings per share for the first quarter of 2019 excluded: (a) equity-based compensation expense, net of taxes, of $2.3 million, (b) the impact of the amortization of acquired intangibles of $0.3 million associated with the acquisition of RivieraWaves and an investment in NB-IoT technologies. Non-GAAP net income and diluted earnings per share for the first quarter of 2018 excluded: (a) equity-based compensation expense, net of taxes, of $2.6 million, and (b) the impact of the amortization of acquired intangibles of $0.4 million associated with the acquisition of RivieraWaves and an investment in NB-IoT technologies.
Yaniv Arieli, Chief Financial Officer of CEVA, stated: "We continue to make prudent R&D investments in strategic growth areas that have enabled us to expand our licensing business. While our royalty business is suffering from weakness in the handset space, we are encouraged by the sustainable year-over-year progress of our non-handset baseband business, particularly in the base station RAN, Bluetooth and IoT markets. Additionally, the company repurchased approximately $2.5 million of its common stock under our existing share repurchase program. At the end of the quarter, our cash balance, marketable securities and bank deposits totaled $171 million, with no debt."
CEVA Conference Call
On May 6, 2019 CEVA management will conduct a conference call at 8:30 a.m. Eastern Time to discuss the operating performance for the quarter.
The conference call will be available via the following dial in numbers:
    --  U.S. Participants: Dial 1-844-435-0316 (Access Code: CEVA)
    --  International Participants: Dial +1-412-317-6365 (Access Code: CEVA)
The conference call will also be available live via webcast at the following link: https://www.webcaster4.com/Webcast/Page/984/30118. Please go to the web site at least fifteen minutes prior to the call to register, download and install any necessary audio software.
For those who cannot access the live broadcast, a replay will be available by dialing +1-877-344-7529 or +1-412-317-0088 (access code: 10130212) from one hour after the end of the call until 9:00 a.m. (Eastern Time) on May 13, 2019. The replay will also be available at CEVA's web site www.ceva-dsp.com.
Forward Looking Statement
This press release contains forward-looking statements that involve risks and uncertainties, as well as assumptions that if they materialize or prove incorrect, could cause the results of CEVA to differ materially from those expressed or implied by such forward-looking statements and assumptions. Forward-looking statements include Mr. Wertheizer's statements about our new NeuPro AI processor design win with an automotive OEM positioning the company at the forefront of level 3 and above autonomous driving, and the decrease in royalty revenue being attributable to excess channel inventory, as well as Mr. Arieli's statement on prospects of a sustainable non-handset baseband business, particularly in the base station RAN, Bluetooth and IoT market segments. The risks, uncertainties and assumptions that could cause differing CEVA results include: the ability of the CEVA DSP cores and other technologies to continue to be strong growth drivers for us; our continued success in penetrating new markets, including in non-baseband markets, and maintaining our market position in existing markets; our ability to diversify the company's royalty streams, the ability of products incorporating our technologies to achieve market acceptance, the speed and extent of the expansion of the 4G, 5G and LTE networks, the maturation of the autonomous driving and IoT markets, the effect of intense industry competition and consolidation, global chip market trends, the possibility that markets for CEVA's technologies may not develop as expected or that products incorporating our technologies do not achieve market acceptance; our ability to timely and successfully develop and introduce new technologies; and general market conditions and other risks relating to our business, including, but not limited to, those that are described from time to time in our SEC filings. CEVA assumes no obligation to update any forward-looking statements or information, which speak as of their respective dates.
About CEVA, Inc.
CEVA is the leading licensor of signal processing platforms and artificial intelligence processors for a smarter, connected world. We partner with semiconductor companies and OEMs worldwide to create power-efficient, intelligent and connected devices for a range of end markets, including mobile, consumer, automotive, industrial and IoT. Our ultra-low-power IPs for vision, audio, communications and connectivity include comprehensive DSP-based platforms for LTE/LTE-A/5G baseband processing in handsets, infrastructure and cellular IoT (NB-IoT and Cat-M) enabled devices, advanced imaging and computer vision for any camera-enabled device, audio/voice/speech and ultra-low power always-on/sensing applications for multiple IoT markets. For artificial intelligence, we offer a family of AI processors capable of handling the complete gamut of neural network workloads, on-device. For connectivity, we offer the industry's most widely adopted IPs for Bluetooth (low energy and dual mode) and Wi-Fi (Wi-Fi 4 (802.11n), Wi-Fi 5 (802.11ac) and Wi-Fi 6 (802.11ax) up to 4x4). Visit us at www.ceva-dsp.com and follow us on Twitter, YouTube, Facebook, LinkedIn and Instagram.
              CEVA, INC. AND ITS SUBSIDIARIES


            CONSOLIDATED STATEMENTS OF INCOME - U.S. GAAP


              U.S. dollars in thousands, except per share data


                                                                         Quarter ended


                                                                           March 31,


                                                                   2019                      2018

                                                                                             ---


              Unaudited

         Unaudited

                                                                                             ---


       Revenues:


        Licensing
         and
         related
         revenues                                               $11,011                   $10,083


        Royalties                                                 5,958                     7,486

                                                                                             ---


        Total
         revenues                                                16,969                    17,569

                                                                                             ---


        Cost of
         revenues                                                 2,023                     1,972

                                                                                             ---


        Gross
         profit                                                  14,946                    15,597

                                                                                             ---


       Operating expenses:


        Research
         and
         development,
         net                                                     12,330                    12,016


        Sales and
         marketing                                                3,021                     3,176


        General
         and
         administrative                                           2,317                     2,954


         Amortization
         of
         intangible
         assets                                                     210                       359


        Total
         operating
         expenses                                                17,878                    18,505

                                                                                             ---


        Operating
         loss                                                   (2,932)                  (2,908)


        Financial
         income,
         net                                                        800                       927


        Loss
         before
         taxes on
         income                                                 (2,132)                  (1,981)


        Taxes on
         income                                                     165                       201

                                                                                             ---


        Net loss                                               $(2,297)                 $(2,182)

                                                                                             ===


        Basic and
         diluted
         net loss
         per
         share                                                  ($0.10)                 ( $0.10)

                                                                                             ===

        Weighted-average shares used to compute
         net loss per share (in thousands):


        Basic                                                    21,917                    22,148

                                                                                             ===

        Diluted                                                  21,917                    22,148

                                                                                             ===
                Unaudited Reconciliation of GAAP to Non-GAAP Financial Measures


                U.S. Dollars in thousands, except per share amounts


                                                                                                    Quarter ended


                                                                                                      March 31,


                                                                                               2019                     2018

                                                                                                                        ---

                                                                                          Unaudited               Unaudited

                                                                                                                        ---


                GAAP net loss                                                    (2,297)                 (2,182)


              Equity-based compensation expense
               included in cost of revenues                                                     136                      157


              Equity-based compensation expense
               included in research and development                                           1,362                    1,269
        expenses


              Equity-based compensation expense
               included in sales and marketing                                                  356                      454
        expenses


              Equity-based compensation expense
               included in general and administrative                                           562                      891
        expenses


              Income tax benefit related to equity-
               based compensation expenses                                                    (137)                   (129)


              Amortization of intangible assets related
               to RivieraWaves transaction                                                      289                      359


                 and NB-IoT technologies


                           Non-GAAP net income                                                 $271                     $819

                                                                                                                        ===


              GAAP weighted-average number of Common
               Stock used in computation                                                     21,917                   22,148
        of diluted net loss per share (in thousands)


              Weighted-average number of shares
               related to outstanding stock-based                                               775                      968
        awards (in thousands)

                                                                                                                        ---


             Weighted-average number of Common Stock used in computation                                          23,116
        of diluted earnings per share, excluding the above (in thousands)
                                                                                             22,692


                           GAAP diluted loss per share                                      ($0.10)                 ($0.10)


              Equity-based compensation expense, net
               of taxes                                                                       $0.10                    $0.12


              Amortization of intangible assets related to RivieraWaves transaction


                   and NB-IoT technologies                                                   $0.01                    $0.02


                           Non-GAAP diluted earnings per share                                $0.01                    $0.04

                                                                                                                        ===
                CEVA, INC. AND ITS SUBSIDIARIES


              CONDENSED CONSOLIDATED BALANCE SHEETS


                (U.S. Dollars in thousands)


                                                                            March 31, December 31,


                                                                                 2019    2018 (*)


                                                                            Unaudited   Unaudited

                                                                                               ---


                ASSETS


     Current assets:


      Cash and cash
       equivalents                                                            $21,469       $22,260


      Marketable
       securities and
       short-term bank
       deposits                                                               135,340       123,608


      Trade receivables,
       net                                                                     19,351        26,156


      Prepaid expenses
       and other current
       assets                                                                   7,630         5,264


      Total current
       assets                                                                 183,790       177,288


     Long-term assets:


      Bank deposits                                                            14,510        21,864


      Severance pay fund                                                        9,629         9,026


      Deferred tax
       assets, net                                                              6,186         5,924


      Property and
       equipment, net                                                           7,265         7,344


      Operating lease
       right-of-use
       assets                                                                   9,501             -


     Goodwill                                                                 46,612        46,612


      Intangible assets,
       net                                                                      2,411         2,700


      Other long-term
       assets                                                                   6,928         6,505


      Total assets                                                           $286,832      $277,263

                                                                                               ===


                LIABILITIES AND STOC
                KHOLDERS' EQUITY


     Current liabilities:


      Trade payables                                                             $750          $632


      Deferred revenues                                                         2,811         3,593


      Accrued expenses
       and other payables                                                      17,849        17,527


      Operating lease
       liabilities                                                              1,549             -


      Total current
       liabilities                                                             22,959        21,752


     Long-term liabilities:


      Accrued severance
       pay                                                                     10,349         9,632


      Operating lease
       liabilities                                                              7,651             -


      Other accrued
       liabilities                                                                561             -


      Total liabilities                                                        41,520        31,384


     Stockholders' equity:


      Common stock                                                                 22            22


      Additional paid in-
       capital                                                                221,071       223,250


      Treasury stock                                                         (35,686)     (39,132)


      Accumulated other
       comprehensive loss                                                       (427)      (1,114)


      Retained earnings                                                        60,332        62,853


      Total stockholders'
       equity                                                                 245,312       245,879


      Total liabilities
       and stockholders'
       equity                                                                $286,832      $277,263

                                                                                               ===


      (*) Derived from audited financial statements
Logo - https://mma.prnewswire.com/media/74483/ceva__inc__logo.jpg
View original content:http://www.prnewswire.com/news-releases/ceva-inc-announces-first-quarter-2019-financial-results-300843923.html
SOURCE CEVA, Inc.
