Sherritt Reports Strong Third Quarter Results and Provides Details of Its Moa JV Expansion Program
Sherritt International Corporation (“Sherritt”, the “Corporation”, the “Company”) (TSX: S), a world leader in the mining and hydrometallurgical refining of nickel and cobalt from lateritic ores, today reported its financial results for the three and nine months ended September 30, 2022. All amounts are in Canadian currency unless otherwise noted.
This press release features multimedia. View the full release here: https://www.businesswire.com/news/home/20221102005834/en/
Appendix 1 - Cobalt Swap Summary (Graphic: Business Wire)
“We are very pleased with the progress we have made in meeting key strategic priorities for the year. With the signing of the agreement to address our Cuban receivables, we are pleased to announce that Sherritt’s Board has approved the next phase of our expansion plans at the Moa Joint Venture. We narrowed the scope of our expansion investment to the most critical components resulting in an estimated cost of US$50 million on a 100% basis. This demonstrates our capital discipline in pursuing our most valuable brownfields growth objectives,” said Leon Binedell, President and CEO of Sherritt International Corporation. “Reaching agreement on our Cuban receivables ahead of defining the expansion scope supports our sound capital and joint venture management. The investment, which builds on our previously approved SPP project, will expand mixed sulphide intermediate production by 6,500 tonnes of contained nickel and cobalt at Moa at a low capital intensity of approximately US$13,200 per annual tonne of contained nickel.”
“We continue to be encouraged by strong market fundamentals for our nickel, cobalt and fertilizer products which we expect will continue into Q4,” continued Mr. Binedell. “Equally important, after months of effort and negotiations, we have finalized an agreement with our Cuban partners on what we believe is a mutually beneficial, innovative arrangement to address our Cuban receivables over five years. This arrangement provides the cash we need to pursue our strategic objectives, and continue to fund our growth initiatives and debt obligations. In addition to the receivables agreement, we received government approval for the extension of our power generation contract for an additional 20 years. Concurrently, we finalized an extension to our “Moa swap” payment agreement, thus ensuring that we maintain our interest in this economically beneficial business while ensuring we have access to foreign currency from our Power business on a timely basis.”
SELECTED Q3 2022 DEVELOPMENTS
- Sherritt had earnings from operations and joint venture for the quarter of $21.3 million, compared to a loss of $10.8 million in the same period in the prior year driven by higher nickel and fertilizer sales volume and realized prices and by the timing of maintenance between the two periods. Our annual maintenance shutdown occurred in the second quarter of this year versus the third quarter last year. Net loss from continuing operations was $26.9 million, or $(0.07) per share, compared to a net loss from continuing operations of $15.5 million, or $(0.04) per share, in Q3 2021. The current period net loss was largely as a result of the recognition of a $48.5 million non-cash loss on revaluation of the allowances for expected credit losses (ACL) on the cobalt swap agreement (the Cobalt Swap) entered into subsequent to the quarter-end related to the repayment of the Energas conditional sales agreement (CSA) receivable as outlined below.
- Sherritt’s adjusted net earnings from continuing operations(1) was $13.9 million, or $0.03 per share for the quarter compared to an adjusted net loss from continuing operations of $13.4 million, or $(0.03) per share in Q3 2021. Similarly, for the nine months ended September 30, 2022 adjusted net earnings from continuing operations was $95.0 million, or $0.24 per share compared to an adjusted net loss from continuing operations of $28.7 million, or $(0.07) per share in the same period in the prior year.
- Adjusted EBITDA(1) in the quarter was $37.4 million compared to $17.6 million in Q3 2021. The improved Adjusted EBITDA was driven by higher nickel and fertilizer sales volume and realized prices and by the timing of maintenance between the two periods. The increase in sales volume was primarily as a result of increased production related to the timing of maintenance activities in the comparative quarters. For the nine months ended September 30, 2022 Adjusted EBITDA was $197.9 million compared to $65.8 million, or 201%, higher than the same period in the prior year.
- Sherritt’s share of finished nickel and cobalt production at the Moa Joint Venture (Moa JV) was 4,443 tonnes and 419 tonnes, respectively. Finished production was higher in the current quarter primarily due to timing of the planned annual maintenance shutdown. Our annual maintenance shutdown occurred in the second quarter of this year versus the third quarter of last year. For the first three quarters of this year, nickel production was 6% higher than the same period last year, while cobalt production was marginally lower primarily due to the higher nickel to cobalt ratio in the mixed sulphides from Moa.
-
Finished nickel sales for the three months ended September 30, 2022 exceeded production volumes while finished nickel sales for the nine months ended September 30, 2022 were lower than production primarily due to logistics-related challenges in transporting finished product to customers experienced late in the second quarter and throughout the third quarter. The temporary order deferrals generally reconciled throughout the third quarter. The order deferrals were largely related to a more cautious restocking approach taken by consumers after resumption of economic activity in China following an easing of zero-COVID policies. The positive consumer sentiment of increasing economic activity in China was tempered by continued recessionary and global inflation fears as well as the reduction of steel manufacturing in Europe due to significantly increased energy costs and energy supply uncertainty. Affected sales orders were partially offset by higher netback sales to other markets and sales to new customers. Finished cobalt sales volumes for both three months and nine months ended September 30, 2022 continued lower than production volumes in Q3 2022, with a contraction in the consumer electronics sector compared with 2021 contributing to reduced lithium cobalt oxide demand.
The Corporation anticipates inventory levels for nickel will reduce to more typical levels by the end of 2022; however, given current market conditions, cobalt inventory levels are expected to reduce to more typical levels in the first quarter of 2023.
- Net direct cash cost (NDCC)(1) at the Moa JV was US$6.76/lb compared to US$4.53/lb in Q3 2021. NDCC was higher in the current year quarter due to higher input commodity costs, including a 131% increase in global sulphur prices, a 46% increase in fuel oil prices and a 156% increase in diesel prices, alongside lower cobalt by-product credit, primarily due to lower cobalt sales relative to the higher nickel sales volume as a result of delayed cobalt sales. Year-to-date to September 30, 2022, NDCC was US$4.39/lb compared to US$4.30/lb in the comparable 2021 period despite the increase in input commodity prices which were largely offset by higher by-product credits.
- In light of lower than expected sales in late Q2 and early Q3 and shipping delays, Sherritt did not receive any distributions from the Moa JV in Q3. Subsequent to the quarter, Sherritt received $20.6 million (US$15.0 million) as its share of distributions from the Moa JV. Given prevailing nickel and cobalt prices, planned spending on capital, including growth capital, working capital needs, and other expected liquidity requirements, Sherritt continues to anticipate higher distributions in the second half of 2022 compared to the first half.
(1) |
Non-GAAP financial measures. For additional information see the Non-GAAP and other financial measures section of this press release. |
EXPANSION PROJECT UPDATE
- With the signing of the Cuban receivables agreements, Sherritt’s Board approved US$50 million (100% basis) as the next phase of the Moa JV expansion plan. The scope of Sherritt’s expansion investment was narrowed to the most critical components and reflect the evolving market for nickel and cobalt. With a market focus on electric vehicle (EV) batteries, Sherritt sees an opportunity to focus its strategy on increasing production of intermediary products that will enable it to fully utilize existing capacity at the refinery and also consider direct sales of intermediate product into the EV battery supply chain.
- With the previously approved Slurry Preparation Plant (SPP) project, the estimated total cost of the two phases of the expansion is approximately US$77 million (100% basis).
- The second phase will focus on expanding mixed sulphide precipitate (MSP) intermediate production and consist of the completion of the Leach Plant Sixth Train and Fifth Sulphide Precipitation Train, and construction of additional acid storage capacity at Moa.
- Upon completion of the SPP, which is still expected in early 2024, and the second expansion phase at the end of 2024, the total increase in MSP is estimated at 20% of current production or 6,500 tonnes of contained metal, resulting in a total capital intensity of approximately US$13,200 per annual tonne of contained nickel.
- Sherritt estimates that two thirds of the increased production will be processed into finished nickel and cobalt fully utilizing the current refinery capacity to process the Moa feed, and the remaining could be sold as MSP.
LIFE OF MINE/UPDATED 43-101 TECHNICAL REPORT
The work to complete the Economic Cut-Off Grade (ECOG) and Life of Mine (LOM) development continues at the Moa mine.
- In Q3, resource model classifications and pit optimization activities were completed. The final development of the LOM is in progress with expectation of mine plan sequencing and reserves estimates to be completed during Q4.
- ECOG and LOM analysis using the latest methodologies are expected to extend the current LOM beyond 2040.
- Continued engagement with the Oficina Nacional de Recursos Minerales (ONRM), Cuba’s Natural Resources Agency, and alignment on the mine execution plan using the new methodologies is expected in Q4.
- Development of the NI 43-101 and peer review will occur during Q4 and early Q1 2023. The final draft of the 43-101 is expected to be released by the end of Q1 2023.
DEVELOPMENTS SUBSEQUENT TO QUARTER END
- Sherritt issued its 2021 sustainability, climate, and tailings management reports as well as its sustainability scorecard outlining the Corporation’s performance on environmental, social, and governance (ESG) matters. Sherritt continues to progress on its commitments to achieving net zero greenhouse emissions by 2050, obtaining 15% of overall energy from renewable sources by 2030, reducing nitrogen oxide emission intensity by 10% by 2024, and increasing the number of women in the workforce to 36% by 2030.
- Sherritt finalized the Cobalt Swap agreement with its Cuban partners to settle its total outstanding Cuban receivables over five years, beginning January 1, 2023. Under this agreement, the Moa JV will prioritize payment of dividends in the form of finished cobalt to each partner, up to an annual maximum volume of cobalt, with any additional dividends in a given year to be distributed in cash. All of the Cuban partner’s share of these cobalt dividends, and potentially additional cash dividends, will be redirected to Sherritt as payment to settle the receivables until the annual maximum cobalt volume and dollar amount limits, including the collection of any prior year shortfalls, has been reached.
- Sherritt and its Cuban partners finalized an extension to the Energas Payment Agreement (the Moa Swap) to fund the operating and maintenance costs of Energas, as well as cover future payments that would be owed to Sherritt. Sherritt expects to continue to receive approximately US$4.2 million ($5.6 million) per month under a payment agreement between Sherritt, Moa JV and Energas. The Moa JV converts foreign currency to Cuban pesos through Energas to support Moa JV’s local Cuban operating activities. The foreign currency is then paid to Sherritt primarily to facilitate foreign currency payments for the Energas operations and to fund dividend repatriations to Sherritt.
- Cuba’s Executive Council of Ministers approved the twenty-year extension of Energas’ power generation contract with the Cuban government to March 2043. The extension of this economically beneficial contract supports Sherritt's on-going investments in Cuba, helps facilitate the Cobalt and Moa Swaps, and supports Cuba’s long-term energy security.
- The Corporation paid interest of $13.2 million on the 8.50% second lien secured notes at the end of October. There were no mandatory redemptions on these notes for the two-quarter period ended June 30, 2022 as the conditions pursuant to the redemption provisions of the indenture agreement were not met. While 50% of the excess cash flow, as defined in the indenture agreement, for this period was $5.5 million, the Corporation did not meet minimum liquidity condition at the interest payment date.
Q3 2022 FINANCIAL HIGHLIGHTS
|
For the three months ended |
|
For the nine months ended |
|
|||||||||||
|
2022 |
2021 |
|
2022 |
2021 |
|
|||||||||
$ millions, except per share amount |
September 30 |
September 30 |
Change |
September 30 |
September 30 |
Change |
|||||||||
|
|
|
|
|
|
|
|
|
|
|
|||||
Revenue |
$ |
30.2 |
$ |
20.7 |
46% |
$ |
130.2 |
$ |
73.6 |
77% |
|||||
Combined revenue(1) |
|
190.1 |
|
120.2 |
58% |
|
613.8 |
|
414.2 |
48% |
|||||
Earnings (loss) from operations and joint venture |
|
21.3 |
|
(10.8) |
297% |
|
118.8 |
|
(12.0) |
nm(2) |
|||||
Net (loss) earnings from continuing operations |
|
(26.9) |
|
(15.5) |
(74%) |
|
71.0 |
|
(27.8) |
355% |
|||||
Net (loss) earnings for the period |
|
(26.3) |
|
(16.2) |
(62%) |
|
70.5 |
|
(32.5) |
317% |
|||||
Adjusted EBITDA(1) |
|
37.4 |
|
17.6 |
113% |
|
197.9 |
|
65.8 |
201% |
|||||
Net (loss) earnings from continuing operations ($ per share) |
|
(0.07) |
|
(0.04) |
(75%) |
|
0.18 |
|
(0.07) |
357% |
|||||
|
|
|
|
|
|
|
|
|
|
|
|||||
Cash provided by continuing operations for operating activities |
|
18.8 |
|
16.2 |
16% |
|
50.0 |
|
14.7 |
240% |
|||||
Combined free cash flow(1) |
|
0.1 |
|
19.3 |
(99%) |
|
21.9 |
|
40.9 |
(46%) |
|||||
Average exchange rate (CAD/US$) |
|
1.306 |
|
1.260 |
4% |
|
1.283 |
|
1.251 |
3% |
|||||
(1) |
Non-GAAP financial measures. For additional information see the Non-GAAP and other financial measures section of this press release. |
|
(2) |
Not meaningful (nm). |
|
|
|
|
|
2022 |
2021 |
|
|||||
$ millions, as at |
|
|
|
September 30 |
December 31 |
Change |
||||||
|
|
|
|
|
|
|
|
|
|
|
||
Cash and cash equivalents |
|
|
|
|
|
$ |
137.6 |
$ |
145.6 |
(5%) |
||
Loans and borrowings |
|
|
|
|
|
|
398.6 |
|
444.5 |
(10%) |
||
Cash and cash equivalents at September 30, 2022 were $137.6 million, up from $124.6 million at June 30, 2022. The increase in cash was primarily due to continued strong fertilizer pre-buys for fall season sales as a result of a generally successful harvest in western Canada, partly offset by the lack of distributions from the Moa JV during the quarter, and $10.4 million of capital expenditures.
Despite not receiving distributions from the Moa JV in the third quarter of 2022, distributions to the end of the quarter totaled $43.4 million (US$34 million). Distributions from the Moa JV are determined based on available cash in excess of liquidity requirements, including anticipated nickel and cobalt prices, planned spending on capital, working capital needs, and other expected liquidity requirements. Sherritt continues to expect distributions in the second half of 2022 to exceed the amount received in the first half of the year. To date in Q4, Sherritt has received $20.6 million (US$15 million) as its share of distributions from the Moa JV.
Sherritt also received US$12.5 million ($16.2 million) from Energas in Q3 which was used to facilitate foreign currency payments for the Energas operations. Concurrent with the finalization of the Cobalt Swap, Sherritt and its Cuban partners agreed to extend the Energas Payment Agreement to fund the operating and maintenance costs of Energas, as well as to cover future payments that would be owed to Sherritt. Sherritt expects to continue to receive approximately US$4.2 million ($5.6 million) per month under the agreement.
Of the $137.6 million of cash and cash equivalents, $36.9 million was held in Canada, up from $28.6 million as at June 30, 2022, and $95.8 million was held at Energas, up from $91.8 million as at June 30, 2022. The remaining amounts were held in Cuba and other countries.
The Cobalt Swap agreement
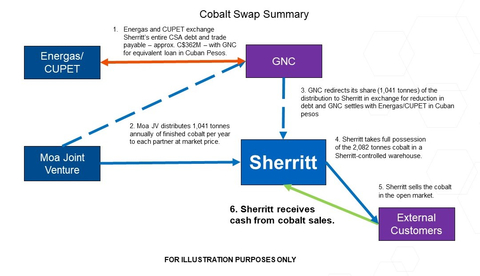
As announced on October 13, Sherritt finalized an agreement with its Cuban partners to settle the total outstanding Cuban receivables over five years, beginning January 1, 2023. Under the agreement, the Moa JV will prioritize payment of dividends in the form of finished cobalt to each partner, up to an annual maximum volume of cobalt, with any additional dividends in a given year to be distributed in cash. All of the Cuban partner’s share of these cobalt dividends, and potentially additional cash dividends, will be redirected to Sherritt as payment to settle the receivables until the annual minimum payment amount and cobalt dividend volume, including the collection of any prior year shortfalls, has been reached.
On January 1, 2023, the outstanding receivable amounts owing to Sherritt from Energas S.A. (Energas) and Union Cuba-Petroleo (CUPET) – estimated to total $362 million – will be assumed by General Nickel Company (GNC), Sherritt’s Moa JV partner, who in turn will enter into payment agreements of an equivalent amount, denominated in Cuban pesos, with Energas and CUPET. This amount includes the Energas conditional sales agreement (Energas CSA) receivable of $332.4 million and trade accounts receivables from CUPET of $29.5 million. This reflects the total amount owing to Sherritt from Energas and CUPET rather than only the overdue amounts (US$153.2 million at September 30, 2022) based on scheduled payments. The Energas CSA balance includes the total amount owing, excluding the 33 1/3% elimination reported in Sherritt’s consolidated financial statements.
No interest will accrue on the Energas CSA to ensure repayment within five years; however, in the event that the total outstanding receivables are not fully repaid by December 31, 2027, interest will accrue retroactively at 8% per annum from January 1, 2023 on the unpaid principal amount, and the unpaid principal and interest amounts will become due and payable to Sherritt by GNC.
Over the five-year period beginning January 1, 2023, the Moa JV expects to distribute a maximum of 2,082 tonnes, or approximately 60% of current production (100% basis), of finished cobalt annually to the joint venture partners (finished cobalt dividends). Accordingly, Sherritt expects to receive a maximum of 1,041 tonnes of the finished cobalt dividends per year in respect of its 50% share of the Moa JV. GNC will redirect its 50% share of the finished cobalt dividends, up to 1,041 tonnes per year, to Sherritt as repayment towards the outstanding receivables, provided that the total cobalt volume redirected has a value of at least US$57 million. Any shortfall in the annual minimum payment amount and cobalt dividend volume, will be carried forward to the subsequent year such that full repayment is expected to be made within five years.
Upon receipt of the finished cobalt dividends, the title to both Sherritt and its partner’s redirected cobalt share will be transferred immediately to a Sherritt warehouse in Fort Saskatchewan, from which Sherritt will sell the finished cobalt in the market.
This transaction represents a significant milestone for Sherritt and is expected to provide significant cash flow to deliver on the Corporation’s strategic priorities to reduce debt and actively expand its business through:
- reasonable certainty the amount will be paid over the five year term of the loan as it is independent of Sherritt’s Cuban partner’s ability to access foreign currency;
- a reasonably certain cash flow to Sherritt of US$114 million annually through the sale of cobalt, half of which will be used to repay the amounts receivable;
- the receipt of the majority of the payments prior to the maturity of the second lien notes in November 2026; and
- an opportunity for early settlement of the receivables through enhanced repayment if the market value of the cobalt increases.
The diagram in Appendix 1 summarizes the key components of the Cobalt Swap.
Adjusted net earnings (loss) from continuing operations(1)
|
|
|
2022 |
|
|
2021 |
||||||
For the three months ended September 30 |
$ millions |
$/share |
$ millions |
$/share |
||||||||
|
|
|
|
|
|
|
|
|
||||
Net (loss) earnings from continuing operations |
$ |
(26.9) |
$ |
(0.07) |
$ |
(15.5) |
$ |
(0.04) |
||||
|
|
|
|
|
|
|
|
|
||||
Adjusting items: |
|
|
|
|
|
|
|
|
||||
Sherritt - Unrealized foreign exchange (gain) loss - continuing operations |
|
(4.6) |
|
(0.01) |
|
7.9 |
|
0.02 |
||||
Corporate - Severance and other contractual benefits expense |
|
- |
|
- |
|
3.1 |
|
0.01 |
||||
Corporate - Unrealized losses on commodity put options |
|
- |
|
- |
|
(1.3) |
|
- |
||||
Corporate - Realized loss on commodity put options |
|
- |
|
- |
|
1.7 |
|
0.01 |
||||
Moa Joint Venture - Inventory obsolescence |
|
0.1 |
|
- |
|
1.3 |
|
- |
||||
Fort Site - Inventory obsolescence |
|
- |
|
- |
|
1.0 |
|
- |
||||
Oil and Gas - Gain on disposal of property, plant and equipment |
|
- |
|
- |
|
(1.2) |
|
- |
||||
Oil and Gas - Realized foreign exchange gain due to Cuban currency unification |
|
- |
|
- |
|
(10.0) |
|
(0.03) |
||||
Oil and Gas and Power - trade accounts receivable, net ACL revaluation |
|
(1.1) |
|
- |
|
(1.4) |
|
- |
||||
Power - Energas conditional sales agreement ACL revaluation(2) |
|
48.5 |
|
0.12 |
|
- |
|
- |
||||
Other(3) |
|
- |
|
- |
|
0.7 |
|
- |
||||
Total adjustments, before tax |
$ |
42.9 |
$ |
0.11 |
$ |
1.8 |
$ |
0.01 |
||||
Tax adjustments |
|
(2.1) |
|
(0.01) |
|
0.3 |
|
- |
||||
Adjusted net earnings (loss) from continuing operations |
$ |
13.9 |
$ |
0.03 |
$ |
(13.4) |
$ |
(0.03) |
||||
|
|
|
|
|
||||||||
|
|
|
2022 |
|
|
2021 |
||||||
For the nine months ended September 30 |
$ millions |
$/share |
$ millions |
$/share |
||||||||
|
|
|
|
|
|
|
|
|
||||
Net earnings (loss) from continuing operations |
$ |
71.0 |
$ |
0.18 |
$ |
(27.8) |
$ |
(0.07) |
||||
|
|
|
|
|
|
|
|
|
||||
Adjusting items: |
|
|
|
|
|
|
|
|
||||
Sherritt - Unrealized foreign exchange gain - continuing operations |
|
(9.5) |
|
(0.02) |
|
(3.3) |
|
(0.01) |
||||
Corporate - Gain on repurchase of notes |
|
(13.8) |
|
(0.03) |
|
(2.1) |
|
(0.01) |
||||
Corporate - Transaction finance charges on repurchase of notes |
|
1.2 |
|
- |
|
- |
|
- |
||||
Corporate - Severance and other contractual benefits expense |
|
- |
|
- |
|
5.5 |
|
0.02 |
||||
Corporate - Unrealized losses on commodity put options |
|
(0.9) |
|
- |
|
3.0 |
|
0.01 |
||||
Corporate - Realized losses on commodity put options |
|
0.9 |
|
- |
|
2.5 |
|
0.01 |
||||
Moa Joint Venture - Inventory obsolescence |
|
0.5 |
|
- |
|
1.3 |
|
- |
||||
Fort Site - Inventory obsolescence |
|
- |
|
- |
|
1.2 |
|
- |
||||
Oil and Gas - Gain on disposal of property, plant and equipment |
|
(1.3) |
|
- |
|
(1.2) |
|
- |
||||
Oil and Gas - Realized foreign exchange gain due to Cuban currency unification |
|
- |
|
- |
|
(10.0) |
|
(0.03) |
||||
Oil and Gas and Power - trade accounts receivable, net ACL revaluation |
|
0.4 |
|
- |
|
0.1 |
|
- |
||||
Power - Energas conditional sales agreement ACL revaluation(2) |
|
49.0 |
|
0.12 |
|
2.7 |
|
0.01 |
||||
Other(3) |
|
- |
|
- |
|
(0.4) |
|
- |
||||
Total adjustments, before tax |
$ |
26.5 |
$ |
0.07 |
$ |
(0.7) |
$ |
- |
||||
Tax adjustments |
|
(2.5) |
|
(0.01) |
|
(0.2) |
|
- |
||||
Adjusted net earnings (loss) from continuing operations |
$ |
95.0 |
$ |
0.24 |
$ |
(28.7) |
$ |
(0.07) |
||||
(1) |
A non-GAAP financial measure. For additional information see the Non-GAAP and other financial measures section of this press release. |
|
(2) |
|
Primarily related to the recognition of a $48.5 million non-cash loss on the revaluation of the ACL on the Energas CSA receivable related to the signing of the Cobalt Swap subsequent to period end and in part as a result of the suspension of interest on the Energas CSA over the five-year period of the agreement. |
(3) |
Other items primarily relate to losses in net finance (expense) income. |
In the three and nine months ended September 30, 2022, the net loss and net earnings from continuing operations, respectively, include the recognition of a $48.5 million non-cash loss on the revaluation of the ACL on the Energas CSA receivable related to the signing of the Cobalt Swap subsequent to period end and in part as a result of the suspension of interest on the Energas CSA over the five-year period of the agreement.
Additionally, net loss and net earnings from continuing operations include unrealized foreign exchange gains of $4.6 million and $9.5 million in the three and nine months ended September 30, 2022, respectively, which compares to an unrealized foreign exchange loss of $7.9 million and unrealized foreign exchange gain of $3.3 million, in the corresponding periods of the prior years, respectively.
METALS MARKET
Nickel
Nickel prices remained relatively constant during the third quarter, with prices ending at US$10.11/lb, down from US$10.48/lb at the end of Q2. The average reference price during Q3 was US$10.01/lb, compared to US$13.13/lb for Q2. Reduced volatility on the London Metal Exchange (LME), continuing COVID-19 restrictions in China, high energy prices and supply concerns in Europe, along with inflationary pressures, and global economic recession concerns have all played a role in tempering the nickel price. The nickel price fluctuated in a relatively narrow range during much of the quarter – reaching a high of US$11.28/lb in September and a low of US$8.66/lb in July for one trading session when all metals dipped. However, in general, the price remained in the US$9.50/lb and US$10.50/lb range for most of the quarter.
Total inventory levels on the LME and Shanghai Futures Exchange (SHFE) continued to decline in Q3 with the total LME and SHFE inventory falling from 66,780 tonnes at the end of Q2 to 54,444 tonnes at the end of Q3.
Near-term market fundamentals are complex, and in some cases juxtaposed, given the uncertainty in the markets as related to declining inventory levels, the slower than expected economic recovery in China, the potential for increasing sanctions on Russian nickel and the possibility of self-sanctioning behaviours, the stronger U.S. dollar against most other currencies, projected nickel supply surpluses, primarily in Class II and particularly NPI, continued global logistics issues, inflationary pressures, and global economic recession concerns.
The long-term outlook for nickel remains positive on account of the strong demand expected from the stainless steel sector, the current largest market for nickel, and the rapidly growing EV battery market. Significant medium-term deficits are projected on continued growth in stainless steel and the exponential growth projected in the EV battery market as countries and automobile manufacturers implement climate change and net-zero strategies. The deficit is expected to be most impactful in the supply of Class I nickel for the EV market, which Sherritt produces.
In September 2022, Wood Mackenzie estimated nickel demand to increase by 43% from 2021 to 2026 and 163% to 2040. Growth to 2040 represents a compound annual growth rate (CAGR) of 4%, with EV battery and storage during the same period increasing at a 11% CAGR offsetting slower growth in stainless steel demand.
Cobalt
Cobalt prices continued their steady decline which started in mid-Q2 to mid-Q3 before increasing thereafter to settle near US$26.00/lb(1) through September after reaching a low of US$24.13/lb in August. The average price for cobalt in Q3 was US$26.57/lb compared to US$37.87/lb in Q2. Cobalt price started the quarter at US$32/lb and closed at $25.90/lb.
Cobalt prices continue to show near-term weakness for much the same reasons as nickel and due to increased supply from the Democratic Republic of Congo (DRC). Ongoing logistics issues relating to the transportation of cobalt hydroxide from the DRC, the world’s largest supply market, recovered somewhat in Q3 and a contraction of the consumer electronics industry compared with 2021 has led to reduced lithium cobalt oxide demand, both contributing to weaker prices.
The expected proliferation of EV’s provides a positive longer-term outlook for demand, which is expected to increase despite the EV industry’s efforts to minimize cobalt content to reduce battery cost and supply risk. According to CRU in September 2022, global cobalt demand is expected to increase at a 13% CAGR to 2027 (from 173 thousand tonnes in 2021 to 369 thousand tonnes in 2027), with EV battery consumption driving much of this increase, at a forecasted 22% CAGR. The cobalt market is much more levered to the EV growth sector providing strong medium-term demand for cobalt and supporting Sherritt’s growth strategy as a reliable top ten cobalt producer over the past decade.
(1) |
In August 2022 the Corporation changed its cobalt reference prices from the standard-grade cobalt published price per Fastmarket MB to the “minimum 99.8% chemical grade – Rotterdam” per Argus Metals. All spot and average cobalt prices for 2022 reflect the Argus Metals Price. |
REVIEW OF OPERATIONS
Moa Joint Venture (50% interest) and Fort Site (100%)
|
For the three months ended |
|
For the nine months ended |
|
||||||||||||
|
2022 |
2021 |
|
2022 |
2021 |
|
||||||||||
$ millions (Sherritt's share), except as otherwise noted |
September 30 |
September 30 |
Change |
September 30 |
September 30 |
Change |
||||||||||
|
|
|
|
|
|
|
|
|
|
|
||||||
FINANCIAL HIGHLIGHTS |
|
|
|
|
|
|
|
|
|
|
||||||
Revenue(1) |
$ |
173.9 |
$ |
108.9 |
60% |
$ |
565.2 |
$ |
377.4 |
50% |
||||||
Cost of Sales(1) |
|
148.3 |
|
92.1 |
61% |
|
390.0 |
|
308.7 |
26% |
||||||
Earnings from operations |
|
23.1 |
|
14.6 |
58% |
|
169.2 |
|
62.1 |
172% |
||||||
Adjusted EBITDA(2) |
|
35.3 |
|
27.1 |
30% |
|
208.4 |
|
102.9 |
103% |
||||||
|
|
|
|
|
|
|
|
|
|
|
||||||
CASH FLOW |
|
|
|
|
|
|
|
|
|
|
||||||
Cash provided by continuing operations for operating activities |
$ |
25.5 |
$ |
36.5 |
(30%) |
$ |
91.4 |
$ |
81.6 |
12% |
||||||
Free cash flow(2) |
|
8.1 |
|
23.2 |
(65%) |
|
51.1 |
|
55.9 |
(9%) |
||||||
|
|
|
|
|
|
|
|
|
|
|
||||||
PRODUCTION VOLUMES (tonnes) |
|
|
|
|
|
|
|
|
|
|
||||||
Mixed Sulphides |
|
4,216 |
|
4,666 |
(10%) |
|
12,248 |
|
12,617 |
(3%) |
||||||
Finished Nickel |
|
4,443 |
|
2,908 |
53% |
|
12,022 |
|
11,326 |
6% |
||||||
Finished Cobalt |
|
419 |
|
334 |
25% |
|
1,261 |
|
1,287 |
(2%) |
||||||
Fertilizer |
|
62,841 |
|
46,730 |
34% |
|
187,893 |
|
180,038 |
4% |
||||||
|
|
|
|
|
|
|
|
|
|
|
||||||
NICKEL RECOVERY(3) (%) |
|
87% |
|
87% |
- |
|
88% |
|
85% |
4% |
||||||
|
|
|
|
|
|
|
|
|
|
|
||||||
SALES VOLUMES (tonnes) |
|
|
|
|
|
|
|
|
|
|||||||
Finished Nickel |
|
4,487 |
|
2,989 |
50% |
|
11,393 |
|
11,434 |
- |
||||||
Finished Cobalt |
|
347 |
|
372 |
(7%) |
|
993 |
|
1,301 |
(24%) |
||||||
Fertilizer |
|
27,373 |
|
25,201 |
9% |
|
108,763 |
|
117,034 |
(7%) |
||||||
|
|
|
|
|
|
|
|
|
|
|
||||||
AVERAGE-REFERENCE PRICE (USD) |
|
|
|
|
|
|
|
|
|
|
||||||
Nickel (US$ per pound)(4) |
$ |
10.01 |
$ |
8.67 |
15% |
$ |
11.66 |
$ |
8.18 |
43% |
||||||
Cobalt (US$ per pound)(5) |
|
26.26 |
|
24.55 |
7% |
|
33.35 |
|
22.46 |
48% |
||||||
|
|
|
|
|
|
|
|
|
|
|
||||||
AVERAGE-REALIZED PRICE (CAD)(2) |
|
|
|
|
|
|
|
|
|
|
||||||
Nickel ($ per pound) |
$ |
12.94 |
$ |
10.76 |
20% |
$ |
14.69 |
$ |
9.99 |
47% |
||||||
Cobalt ($ per pound) |
|
28.21 |
|
27.03 |
4% |
|
37.59 |
|
23.69 |
59% |
||||||
Fertilizer ($ per tonne) |
|
531.10 |
|
432.63 |
23% |
|
823.91 |
|
391.73 |
110% |
||||||
|
|
|
|
|
|
|
|
|
|
|
||||||
UNIT OPERATING COST(2) (US$ per pound) |
|
|
|
|
|
|
|
|
|
|
||||||
Nickel - net direct cash cost |
$ |
6.76 |
$ |
4.53 |
49% |
$ |
4.39 |
$ |
4.30 |
2% |
||||||
|
|
|
|
|
|
|
|
|
|
|
||||||
SPENDING ON CAPITAL(2) |
|
|
|
|
|
|
|
|
|
|
||||||
Sustaining |
$ |
16.2 |
$ |
13.2 |
23% |
$ |
44.4 |
$ |
25.6 |
73% |
||||||
Growth |
|
1.9 |
|
- |
- |
|
3.0 |
|
- |
- |
||||||
|
$ |
18.1 |
$ |
13.2 |
37% |
$ |
47.4 |
$ |
25.6 |
85% |
||||||
(1) |
Revenue and Cost of sales of Moa Joint Venture and Fort Site is composed of revenue/cost of sales, respectively, recognized by the Moa Joint Venture at Sherritt’s 50% share, which is equity-accounted and included in share of earnings (loss) of Moa Joint Venture, net of tax, and revenue/cost of sales recognized by Fort Site, which is included in consolidated revenue. For a breakdown of revenue between Moa Joint Venture and Fort Site see the Combined revenue section in the Non-GAAP and other financial measures section of this press release. |
|
(2) |
Non-GAAP financial measures. For additional information see the Non-GAAP and other financial measures section of this press release. |
|
(3) |
The nickel recovery rate measures the amount of finished nickel that is produced compared to the original nickel content of the ore that was mined. |
|
(4) |
The average nickel reference price for the nine months ended September 30, 2022 was impacted by the suspension of nickel trading and disruption events on the LME in March 2022. The calculation of the average nickel reference price for the nine months ended September 30, 2022 is based on LME guidance for disruption events, which uses the next available price after a disruption event. |
|
(5) |
In August 2022, the Corporation changed its cobalt reference price from the average standard-grade published price per Fastmarkets MB to the “minimum 99.8% chemical grade – Rotterdam” price per Argus Metals. All cobalt spot and average prices referenced for the three and nine months ended September 30, 2022 reflect the Argus Metals price. Comparative amounts and the three and nine months ended September 30, 2021 are Fastmarkets MB prices. |
Revenue in Q3 2022 increased by 60% to $173.9 million from $108.9 million in the same period last year. The revenue increase was largely attributable to higher sales volume and average-realized prices(1) for nickel and fertilizers. Cobalt revenue was marginally lower in the quarter due to lower sales volume, partly offset by higher average-realized price. Sales volume for nickel was consistent with higher production volume; however, the cobalt sales volume was impacted again this quarter by continued contract delays and logistical issues.
Mixed sulphides production at the Moa JV in Q3 2022 was 4,216 tonnes, down 10% from the 4,666 tonnes produced in Q3 2021. The variance was primarily due to mining limitations caused by a combination of higher precipitation, lower diesel supply and lower equipment availabilities. Hurricane Ian did not directly impact Moa, but the resulting Cuban national power grid outage caused the mine and plant to temporarily operate at reduced capacity; however, this impact was not material.
Sherritt’s share of finished nickel production in Q3 2022 totaled 4,443 tonnes, 53% higher than the 2,908 tonnes produced in Q3 2021, while finished cobalt production for Q3 2022 was 419 tonnes, up 25% from the 334 tonnes produced in the same period last year. Higher finished metals production in Q3 2022 was primarily a result of the timing of the annual maintenance shutdown. In 2022, the annual maintenance shutdown was in Q2 compared to Q3 in 2021. In 2021, the annual maintenance shutdown was rescheduled due to the impact of COVID-19 and contractor availability. Production in the prior year was also impacted by unplanned maintenance and transportation delays in shipping mixed sulphides from Moa to the refinery.
On a year-to-date basis, finished nickel production was 6% higher primarily due to unplanned maintenance and transportation delays during Q3 2021, while cobalt was 2% lower, primarily due to the higher nickel to cobalt ratio in mixed sulphides produced at Moa.
Finished nickel sales for the three months ended September 30, 2022 exceeded production volumes while finished nickel sales for the nine months ended September 30, 2022 were lower than production primarily due to logistics-related challenges in transporting finished product to customers experienced late in the second quarter and throughout the third quarter. The temporary order deferrals generally reconciled throughout the third quarter. The order deferrals were largely related to a more cautious restocking approach taken by consumers after resumption of economic activity in China following an easing of zero-COVID policies. The positive consumer sentiment of increasing economic activity in China was tempered by continued recessionary and global inflation fears as well as the reduction of steel manufacturing in Europe due to significantly increased energy costs and energy supply uncertainty. Affected sales orders were partially offset by higher netback sales to other markets and sales to new customers. Finished cobalt sales volumes for both three months and nine months ended September 30, 2022 continued lower than production volumes in Q3 2022, with a contraction in the consumer electronics sector compared with 2021 contributing to reduced lithium cobalt oxide demand.
The Corporation anticipates inventory levels for nickel will reduce to more typical levels by the end of 2022; however, given current market conditions, cobalt inventory levels are expected to reduce to more typical levels in the first quarter of 2023.
Guidance for nickel and cobalt production remains unchanged; however, based on the expected nickel to cobalt ratio in the ore, finished cobalt production is estimated to be at the lower end of the 3,400 – 3,700 tonne range.
Fertilizer production for the three months ended September 30, 2022 was higher compared to the same period in the prior year in line with higher metals production, timing of maintenance activities and production capacity improvements. Fertilizer sales volume was higher reflecting an early start on the fall fertilizer season given good harvest weather, early crop harvesting in general on the Prairies and efforts by Sherritt to secure more out of season sales with customers.
Mining, processing and refining (MPR) costs per pound of nickel sold in Q3 2022 were up 23% from Q3 2021. Higher MPR costs in Q3 2022 continue to be driven by the rise in input costs, including a 131% increase in global sulphur prices, a 46% increase in fuel oil prices and a 156% increase in diesel prices. Since the quarter end, sulphur prices have declined and are projected to remain lower than Q3 in the near-term.
Net direct cash cost (NDCC)(1) per pound of nickel sold increased by 49% to US$6.76/lb in Q3 2022 from US$4.53/lb in Q3 2021. The higher NDCC was primarily due to higher MPR costs as discussed above and lower cobalt by-product credits. While cobalt revenue was only marginally lower in the current year quarter, the cobalt credit in NDCC was 38% lower as a result of lower cobalt sales relative to the higher nickel sales volume. The impact of higher MPR and lower cobalt by-product credit was partly offset by higher net fertilizer by-product credits. Year-to-date to September 30, 2022, NDCC was US$4.39/lb compared to US$4.30/lb in the comparable period in the prior year despite significant increases in input prices, mainly on the back of increased by-product credits.
As a result of softening cobalt and fertilizer prices and logistical issues related to delivery of cobalt sales, NDCC guidance range has been increased to US$4.50 – US$5.00/lb.
Sustaining spending on capital in Q3 2022 was $16.2 million, up 23% from $13.2 million in Q3 2021. The year-over-year increase was due primarily to higher planned spending at both the Moa JV and Fort Site. Growth spending on capital, which represents spending on the joint venture’s expansion projects, was $1.9 million, most of which was related to spending on the slurry preparation plant.
Guidance for sustaining spending on capital remains unchanged; however, the Corporation revised its guidance for growth spending on capital at Moa JV to $10 million from $19 million as a result of the deferral of spending on next phase of the Moa expansion into 2023.
(1) |
|
Non-GAAP financial measures. For additional information see the Non-GAAP and other financial measures section of this press release. |
Expansion Project Update
With the signing of the Cobalt Swap, Sherritt’s Board approved US$50 million (100% basis) as the next phase of the Moa JV expansion plan. The scope of Sherritt’s expansion investment was narrowed to the most critical components and reflect the evolving market for nickel and cobalt. With a market focus on EV batteries, Sherritt sees an opportunity to focus its strategy on increasing production of intermediary products that will enable it to fully utilize existing capacity at the refinery and also consider direct sales of intermediate product into the EV battery supply chain.
In addition to the US$27 million (100% basis) previously approved by Sherritt and the Moa JV Boards, for the slurry preparation plant, the next phase of Moa expansion will include the completion of the Leach Plant Sixth Train and Fifth Sulphide Precipitation Train and construction of additional acid storage capacity at Moa. The new phase is expected to increase mixed sulphide precipitate (MSP) intermediate production by 4,800 tonnes of contained nickel and cobalt. This phase is expected to have a positive impact of reducing the NDCC by approximately US$0.20/lb.
With the previously approved SPP project the estimated total cost of the two phases of the expansion is approximately US$77 million (100% basis). With the completion of the SPP, which is expected in early 2024, and the second expansion phase at the end of 2024, the total increase in MSP is estimated at 20% of current production or 6,500 tonnes of contained nickel and cobalt, resulting in a total capital intensity of approximately US$13,200 per annual tonne of contained nickel for the full expansion. Of the total increased production, Sherritt estimates that two thirds will be processed into finished nickel and cobalt fully utilizing the current refinery capacity to process the Moa feed, and the remaining could be sold as MSP.
Sherritt believes there is an active intermediate market, and given developing market conditions, expects to be able to have the option to sell the MSP into the market.
Progress for the expansion projects in Q3 2022 included:
Slurry Preparation Plant
The SPP project remains on budget and schedule for completion in early 2024 and is expected to deliver a number of benefits including reduced ore haulage, lower carbon intensity from mining and increased annual MSP production of 1,700 tonnes;
- Ongoing construction of the SPP at Moa is progressing on schedule with civil construction 80% complete, and 96% of the contracts for supply of materials and services awarded. In addition, the structural steel pre-fabrication is ongoing and erection will commence in November along with field assembly of major equipment; and
- Up until Q3 2022, US$10.7 million (100% basis) in growth spending on capital has been committed and is prioritized on long lead materials and equipment, construction supplies and civil and mechanical construction.
Moa Processing
The Moa Expansion consists of the completion of the Leach Plant Sixth Train and Fifth Sulphide Precipitation Train and construction of additional acid storage capacity:
- Detailed engineering review of the Leach Plant Sixth Train has been completed to confirm the engineering work done with the initial expansion;
- The first stage of the Feasibility Study for the Leach Plant has been approved by Cuban authorities allowing for the ordering of long lead items. The final stage of the Feasibility Study, encompassing the full project scope, is near completion and is required for final Cuban authority approval of the project; and
- Bids are being solicited for the long lead items for the Leach Plant Sixth Train thus ordering can commence as part of the preliminary approval.
Basic engineering will commence in Q1 2023 on the Fifth Sulphide Precipitation Train and additional acid storage capacity.
Refinery
With the focus being on investing in those components which provide opportunity to increase intermediary products, utilize current refinery capacity, and potentially sell MSP directly into the market to serve the EV market, the refinery expansion has been put on hold. Sherritt retains the option to expand the refinery at a later date.
Current combined refinery production capacity is approximately 38,200 tonnes of finished nickel and cobalt. Upon completion of the expansion project in 2024, approximately two thirds of the increased MSP production will be processed into finished product. Any excess MSP over the refinery capacity will be available for sale as an intermediary product. To accommodate the additional refining of MSP production from Moa, some lower margin third-party feed production will be reduced.
The diagram in Appendix 2 provides a pro forma example of the expected impact of the expansion.
Spending on growth capital is expected to be self-funded by the Moa Joint Venture primarily using operating cash flows. Total growth spending on capital of $10 million (50% basis) (US$15.0 million (100% basis)) is expected in 2022, primarily related to the SPP, ordering of long lead items, and engineering work related to the Moa expansion. The reduction in current year guidance and spending is mainly due to the deferral of spending on the next phase of the Moa expansion which will occur in 2023.
Life of Mine/Updated 43-101 Technical Report
The work to complete the Economic Cut-Off Grade (ECOG) and Life of Mine (LOM) development continues at the Moa mine.
- In Q3, resource model classifications and pit optimization activities were completed. The final development of the LOM is in progress with expectation of mine plan sequencing and reserves estimates to be completed during Q4.
- ECOG and LOM analysis using the latest methodologies are expected to extend the current LOM to beyond 2040.
- Continued engagement with the Oficina Nacional de Recursos Minerales (ONRM), Cuba’s Natural Resources Agency, and alignment on the mine execution plan using the new methodologies is expected in Q4.
- Development of the NI 43-101 and peer review will occur during Q4 and early Q1 2023. The final draft of the 43-101 is expected to be released by the end of Q1 2023.
Power
|
For the three months ended |
|
For the nine months ended |
|
||||||||||||
|
2022 |
2021 |
|
2022 |
2021 |
|
||||||||||
$ millions (33 ⅓% basis), except as otherwise noted |
September 30 |
September 30 |
Change |
September 30 |
September 30 |
Change |
||||||||||
|
|
|
|
|
|
|
|
|
|
|
||||||
FINANCIAL HIGHLIGHTS |
|
|
|
|
|
|
|
|
|
|
||||||
Revenue |
$ |
9.0 |
$ |
7.3 |
23% |
$ |
26.6 |
$ |
20.2 |
32% |
||||||
Cost of sales |
|
6.8 |
|
6.5 |
5% |
|
19.3 |
|
19.1 |
1% |
||||||
Earnings (loss) from operations |
|
1.4 |
|
0.2 |
600% |
|
4.2 |
|
(1.1) |
482% |
||||||
Adjusted EBITDA(1) |
|
5.5 |
|
4.1 |
34% |
|
16.2 |
|
10.6 |
53% |
||||||
|
|
|
|
|
|
|
|
|
|
|
||||||
CASH FLOW |
|
|
|
|
|
|
|
|
|
|
||||||
Cash provided by continuing operations for operating activities |
$ |
9.1 |
$ |
3.0 |
203% |
$ |
23.9 |
$ |
17.3 |
38% |
||||||
Free cash flow(1) |
|
6.0 |
|
3.0 |
100% |
|
20.3 |
|
17.3 |
17% |
||||||
|
|
|
|
|
|
|
|
|
|
|
||||||
PRODUCTION AND SALES |
|
|
|
|
|
|
|
|
|
|
||||||
Electricity (GWh(2)) |
|
139 |
|
110 |
26% |
|
409 |
|
320 |
28% |
||||||
|
|
|
|
|
|
|
|
|
|
|
||||||
AVERAGE-REALIZED PRICE(1) |
|
|
|
|
|
|
|
|
|
|
||||||
Electricity ($/MWh(2)) |
$ |
57.02 |
$ |
54.57 |
4% |
$ |
55.67 |
$ |
53.93 |
3% |
||||||
|
|
|
|
|
|
|
|
|
|
|
||||||
UNIT OPERATING COSTS(1) |
|
|
|
|
|
|
|
|
|
|
||||||
Electricity ($/MWh) |
|
20.04 |
|
23.14 |
(13%) |
|
18.60 |
|
23.19 |
(20%) |
||||||
|
|
|
|
|
|
|
|
|
|
|
||||||
NET CAPACITY FACTOR (%) |
|
43 |
|
35 |
23% |
|
43 |
|
34 |
26% |
||||||
|
|
|
|
|
|
|
|
|
|
|
||||||
SPENDING ON CAPITAL(1) |
|
|
|
|
|
|
||||||||||
Sustaining |
$ |
3.0 |
$ |
- |
- |
$ |
3.5 |
$ |
- |
- |
||||||
|
$ |
3.0 |
$ |
- |
- |
$ |
3.5 |
$ |
- |
- |
||||||
(1) |
Non-GAAP financial measures. For additional information see the Non-GAAP and other financial measures section of this press release. |
|
(2) |
Gigawatt hours (GWh), Megawatt hours (MWh). |
Power production in Q3 2022 was 139 gigawatt hours (GWh) of electricity, up 26% from 110 GWh produced in the comparable period of 2021 resulting primarily from the timing of maintenance activities. In Q3 2021, maintenance at the Boca facility reduced production and sales volumes. Accordingly, revenue in Q3 2022 totaled $9 million, up 23% from $7.3 million for the same quarter last year.
Based on production for the nine months ended Q3 2022, the production guidance range was increased to 525-550 GWh for 2022 due to the increased availability of gas supply. For 2023, Sherritt is in discussions with its Cuban partners to develop additional gas supply for the Boca facility.
Unit operating costs(1) in Q3 2022 were $20.04/MWh, down 13% from $23.14/MWh in Q3 2021. The year-over-year improvement was driven by higher power production and sales volumes. The unit cost guidance range was decreased to $22.00 – 23.00/MWh as a result of increased power production and delays in delivery of some parts and supplies into Q1 2023 which are required for maintenance activities that were scheduled for Q4 2022.
The Power business unit had $3.0 million in spending on capital in the third quarter of 2022, primarily driven by maintenance activities. Spending on capital to-date is in line with guidance for the year which is forecast at $5 million.
Sherritt received US$12.5 million ($16.2 million) in the quarter as part of the Moa swap agreement, all of which was used to facilitate foreign currency payments for the Energas operations.
Subsequent to the quarter-end:
- The Corporation signed the Cobalt Swap with its Cuban partners to settle its total outstanding Cuban receivables over five years, beginning January 1, 2023, which includes the Energas CSA receivable of approximately $332 million, as outlined above. Under the agreements, the Moa JV will prioritize payment of dividends in the form of finished cobalt to each partner, up to an annual maximum volume of cobalt, with any additional dividends in a given year to be distributed in cash. All of the Cuban partner’s share of these cobalt dividends, and potentially additional cash dividends, will be redirected to Sherritt as payment to settle the receivables until an annual finished cobalt volume and dollar amount limit, including the collection of any prior year shortfalls, has been reached.
- Sherritt and its Cuban partners finalized an extension to the Energas Payment Agreement to fund the operating and maintenance costs of Energas, as well as cover future payments that would be owed to Sherritt. Sherritt expects to continue to receive approximately US$4.2 million ($5.6 million) per month under a payment agreement between Sherritt, Moa JV and Energas. The Moa JV converts foreign currency to Cuban pesos through Energas to support Moa JV’s local Cuban operating activities. The foreign currency is then paid to Sherritt primarily to facilitate foreign currency payments for the Energas operations and to fund dividend repatriations to Sherritt.
- Cuba’s Executive Council of Ministers approved the twenty-year extension of Energas’ power generation contract with the Cuban government to March 2043. The extension of this economically beneficial contract supports Sherritt's on-going investments in Cuba, helps facilitate the Cobalt and Moa Swaps, and supports Cuba’s long-term energy security.
- Sherritt received an additional payment of US$4.2 million ($5.7 million) in October and expects to continue to receive sufficient liquidity to support operations for the remainder of the year.
(1) |
Non-GAAP financial measure. For additional information see the Non-GAAP and other financial measures section of this press release. |
Technologies
During the three months ended September 30, 2022, Sherritt Technologies (Technologies) continued to support the Moa JV’s expansion strategy. These activities included establishing an economic cut-off grade for determining reserves to optimize mine planning and upgrade resources into reserves, and supporting on-going process plant capacity testing and debottlenecking work at both Moa and the Fort Site locations.
In addition, Sherritt Technologies continued to advance development and commercialization of its most promising and innovative proprietary technologies:
-
“Chimera”/”D-POX” – suite of processes for the treatment of complex copper and precious metals concentrates (or other high arsenic content feeds) that enable high recoveries of base and precious metals while providing a significant step change in the stabilization of arsenic bearing solid waste. Chimera combines complex copper concentrate and laterite processing into a single facility that enables additional environmental and economic benefits and the production of nickel and cobalt intermediate by-products. D-POX is a pressure oxidation process that enables treatment of higher arsenic concentrations while simplifying silver recovery.
During the quarter, Technologies continued discussions with potential interested parties within the copper industry and advanced proposals for potential batch testing and piloting programs for specific copper project opportunities. Moreover, Technologies is advancing opportunities to utilize these technologies within the precious metals concentrate markets.
-
Dense slurry hydroprocessing (DSH) – metallurgical reactor technology being applied to the processing of bio-oils into second-generation renewable fuels, upgrading of refinery vacuum residue to create value add products and upgrading heavy oils and bitumen. Utilizing the DSH reactor platform for bio-oils would overcome many of the challenges associated with commonly utilized fixed bed designs.
During the quarter, Technologies continued to advance it assessment of the technology on bio-oils and refinery vacuum residues. Batch testing during the quarter demonstrated the potential to produce a renewable diesel product. Technologies also demonstrated the ability for significant conversion of refinery vacuum residues into higher value products and continued its front-end engineering work on different scale facilities to satisfy the technical assessment requirements of potential partners.
-
Next-generation laterite (NGL) processing – novel processing flowsheet with the potential to make processing of lateritic ores more economically viable and sustainable while enabling the supply of nickel and cobalt products from lateritic ores to the battery sector.
Following completion of the initial unit operation pilot testing in the second quarter of 2022 which demonstrated the ability for selective leaching of nickel and cobalt from both saprolite and limonite ores, in the third quarter the piloting on the other unit operations were completed and results demonstrated high metal extraction rates into a final mixed hydroxide product.
Environmental, Social and Governance update
Sherritt issued its 2021 sustainability, climate and tailings management reports as well as its sustainability scorecard outlining the Corporation’s performance on environmental, social, and governance (ESG) matters. Highlights include:
- Continued peer-leading safety performance, with the Total Recordable Incident Frequency Rate of 0.34 and the Lost Time Incident Frequency Rate of 0.14, a decrease of 48% and 75%, respectively, over the last three years;
- Experienced zero work-related fatalities at Sherritt’s operations for the sixth consecutive year;
- Continued to meet safety and production targets at all sites despite the COVID-19 pandemic, prioritizing the health and safety of employees, contractors and the communities in which Sherritt operates;
- Developed a climate plan to advance a road map to achieve long-term net-zero GHG emissions by 2050;
- Had no material tailings-related incidents;
- Contributed almost $1 million to community investment projects in 2021; and
- Experienced no security incidents involving allegations of human rights abuses at any of Sherritt’s operations.
Sherritt continues to progress on its commitments to achieving net zero greenhouse emissions by 2050, obtaining 15% of overall energy from renewable sources by 2030, reducing nitrogen oxide emission intensity by 10% by 2024, and increasing the number of women in the workforce to 36% by 2030.
2022 REVIEW OF STRATEGIC PRIORITIES
The table below lists Sherritt’s Strategic Priorities for 2022, and summarizes how the Corporation has performed against those priorities.
2022 Strategic Priorities |
Selected Actions |
Status |
||||
ESTABLISH SHERRITT AS A LEADING GREEN METALS PRODUCER |
Accelerate plans to expand Moa JV nickel and cobalt production by up to 20% from the combined 34,710 tonnes produced in 2021. |
Continued to progress on SPP which remains on time and budget. Sherritt’s Board approved investment, of US$50 million (100% basis) as the next phase of the expansion to increase total mixed sulphide precipitate intermediate production by 6,500 tonnes of contained metals at Moa at a low capital intensity of approximately US$13,200 per annual tonne of contained nickel. |
||||
|
Rank in lowest quartile of HPAL nickel producers for NDCC. |
NDCC(1) for the YTD 2022 of US$4.39/lb ranked Sherritt in the second cost quartile of all nickel producers. |
||||
Normalization of key input costs would help return Sherritt to ranking in the first quartile |
||||||
LEVERAGE TECHNOLOGIES FOR TRANSFORMATIONAL GROWTH |
Support Moa JV expansion, operational improvements, and life of mine extension. |
Continued to support the planning for the Moa JV growth strategy and life of mine extension at Moa. ECOG and LOM analysis using the latest methodologies are expected to extend the current LOM to beyond 2040. |
||||
|
Advance Technologies solutions toward commercialization. |
Continued to advance development and commercialization of most promising and innovative technologies, including: Chimera/D-POX – continued discussions with potential interested parties and advanced proposals for potential batch testing and piloting programs for specific copper project opportunities. DSH – continued to advance its assessment of the technology on bio-oils and refinery vacuum residues. Batch testing demonstrated the potential to produce a renewable diesel product. NGL – Unit operation pilot testing demonstrated the ability for selective leaching of nickel and cobalt from both saprolite and limonite ores with high metal extraction rates into a mixed hydroxide product. |
||||
ACHIEVE BALANCE SHEET STRENGTH |
Maximize collections of overdue Cuban receivables. Maximize available liquidity to support growth strategy. |
Signed agreements in October 2022 to settle the full amount – $362 million – of receivables on the Energas CSA and Oil and Gas trade receivables by the end of 2027 through the use of the Cobalt Swap. In Q2, purchased $59.2 million principal amount of notes at a discount reducing annualized interest expense by $5.5 million. |
||||
|
Continue to optimize costs to reflect operating footprint. |
Implemented measures relating to director compensation and employee costs that will result in annual savings of $3 million. |
||||
BE RECOGNIZED AS A SUSTAINABLE ORGANIZATION |
Deliver on actions identified in the Sustainability Report. |
Issued Sherritt’s 2021 sustainability reports and scorecard in October 2022. |
||||
|
Achieve year-over-year ESG improvements including reduction of carbon intensity. |
Developed a climate plan to advance a road map to achieve long-term net-zero GHG emissions by 2050. Continued replacing vehicles and equipment with EVs and electric equipment at Moa and the Fort Site. |
||||
|
Deliver on ‘Diversity and Inclusion’ global framework |
Made progress in defining metrics, analyzing workforce demographics and aligning Sustainability (CSR) investments with D&I initiatives. Improved gender balance in the operations senior management team and board. |
||||
MAXIMIZE VALUE FROM CUBAN ENERGY BUSINESSES |
Extend economically beneficial Energas power generation contract beyond 2023. |
In October 2022, received approval for extension of the Energas power generation contract to March 2043, and finalized extension of the Moa Swap agreement to support liquidity and secure sustainable operations. |
||||
(1) |
Non-GAAP financial measure. For additional information see the Non-GAAP and other financial measures section of this press release. |
OUTLOOK
2022 production volumes, unit operating costs and spending on capital guidance
|
Guidance |
Year-to-date |
Updated |
|
for 2022 - |
actuals - |
2022 guidance - |
Production volumes, unit operating costs and spending on capital |
Total |
Total |
Total |
|
|
|
|
Production volumes |
|
|
|
Moa Joint Venture (tonnes, 100% basis) |
|
|
|
Nickel, finished |
32,000 - 34,000 |
24,044 |
No change |
Cobalt, finished |
3,400 - 3,700 |
2,522 |
No change |
Electricity (GWh, 33⅓% basis) |
450 - 500 |
409 |
525 - 550 |
|
|
|
|
Unit operating costs(1) |
|
|
|
Moa Joint Venture - NDCC (US$ per pound) |
$4.00 - $4.50 |
$4.39 |
$4.50 - $5.00 |
Electricity (unit operating cost, $ per MWh) |
$26.50 - $28.00 |
$18.60 |
$22.00 - $23.00 |
|
|
|
|
Spending on capital(1)($ millions) |
|
|
|
Sustaining |
|
|
|
Moa Joint Venture (50% basis), Fort Site (100% basis)(2)(3) |
$60.0 |
$44.4 |
No change |
Power (33⅓% basis) |
$5.0 |
$3.5 |
No change |
Growth |
|
|
|
Moa Joint Venture (50% basis) |
$19.0 |
$3.0 |
$10.0 |
Spending on capital(3)(4) |
$84.0 |
$50.9 |
$75.0 |
(1) |
|
Non-GAAP financial measures. For additional information see the Non-GAAP and other financial measures section of this press release. |
(2) |
|
Spending is 50% of expenditures for the Moa Joint Venture and 100% expenditures for Fort Site fertilizer and utilities. |
(3) |
|
2022 guidance was updated July 27, 2022, |
(4) |
|
Excludes spending on capital of the Metals Other, Oil and Gas, Technologies and Corporate segments. |
Moa JV and Fort Site
- Guidance for nickel and cobalt production remains unchanged; however, based on the expected nickel to cobalt ratio in the ore, finished cobalt production is estimated to be at the lower end of the 3,400 – 3,700 tonne range.
- As a result of softening cobalt and fertilizer prices and logistical issues related to delivery of cobalt sales, NDCC guidance range has been increased to US$4.50 – US$5.00/lb.
- Guidance for sustaining spending on capital remains unchanged, however, the Corporation revised its guidance for growth spending on capital at Moa JV to $10 million from $19 million as a result of the deferral of spending on next phase of the Moa expansion into 2023.
Power
- Based on production for the nine months ended Q3 2022 the production guidance range was increased to 525 – 550 GWh due to the increased availability of gas supply.
- The unit cost guidance range was decreased to $22.00 – $23.00/MWh as a result of increased power production and delays in delivery of some parts and supplies into Q1 2023 which are required for maintenance activities that were scheduled for Q4 2022.
CONFERENCE CALL AND WEBCAST
Sherritt will hold its conference call and webcast November 3, 2022 at 10:00 a.m. Eastern Time to review its Q3 2022 results. Dial-in and webcast details are as follows:
North American callers, please dial: |
1 (888) 886-7786 Passcode: 84034622 |
|
International callers, please dial: |
1 (416) 764-8658 Passcode: 84034622 |
|
Live webcast: |
Please dial in 15 minutes before the start of the call to secure a line. Alternatively, listeners can access the conference call and presentation via the webcast available on Sherritt’s website.
An archive of the webcast and replay of the conference call will also be available on the website.
FINANCIAL STATEMENTS AND MANAGEMENT’S DISCUSSION AND ANALYSIS
Sherritt’s condensed consolidated financial statements and MD&A for the three and nine months ended September 30, 2022 are available at www.sherritt.com and should be read in conjunction with this news release. Financial and operating data can also viewed in the investor relations section of Sherritt’s website on SEDAR at www.sedar.com.
NON-GAAP AND OTHER FINANCIAL MEASURES
Management uses the following non-GAAP and other financial measures in this press release and other documents: combined revenue, adjusted earnings before interest, taxes, depreciation and amortization (Adjusted EBITDA), average-realized price, unit operating cost/net direct cash cost (NDCC), adjusted net earnings/loss from continuing operations, adjusted earnings/loss from continuing operations per share, spending on capital and combined free cash flow.
Management uses these measures to monitor the financial performance of the Corporation and its operating divisions and believes these measures enable investors and analysts to compare the Corporation’s financial performance with its competitors and/or evaluate the results of its underlying business. These measures are intended to provide additional information, not to replace International Financial Reporting Standards (IFRS) measures, and do not have a standard definition under IFRS and should not be considered in isolation or as a substitute for measures of performance prepared in accordance with IFRS. As these measures do not have a standardized meaning, they may not be comparable to similar measures provided by other companies.
The non-GAAP and other financial measures are reconciled to their most directly comparable IFRS measures in the Appendix below. This press release should be read in conjunction with Sherritt’s condensed consolidated financial statements for the three and nine months ended September 30, 2022.
ABOUT SHERRITT INTERNATIONAL CORPORATION
Headquartered in Toronto, Sherritt is a world leader in using hydrometallurgical processes to mine and refine nickel and cobalt – metals essential for an electric future. Its Technologies Group creates innovative, proprietary solutions for natural resource-based industries around the world to improve environmental performance and increase economic value. Sherritt has embarked on a multi-pronged growth strategy focused on expanding nickel and cobalt production by up to 20% from 2021 and extending the life of mine at Moa beyond 2040. The Corporation is also the largest independent energy producer in Cuba. Sherritt’s common shares are listed on the Toronto Stock Exchange under the symbol “S”.
FORWARD-LOOKING STATEMENTS
This press release contains certain forward-looking statements. Forward-looking statements can generally be identified by the use of statements that include such words as “believe”, “expect”, “anticipate”, “intend”, “plan”, “forecast”, “likely”, “may”, “will”, “could”, “should”, “suspect”, “outlook”, “potential”, “projected”, “continue” or other similar words or phrases. Specifically, forward-looking statements in this document include, but are not limited to, statements regarding strategies, plans and estimated production amounts resulting from expansion of mining operations at the Moa Joint Venture, growing and increasing nickel and cobalt production, extending the Moa life of mine, conversion of mineral resources to reserves, commercializing Technologies projects, growing shareholder value, updating technical reports and optimizing mine planning and performance; statements set out in the “Outlook” section of this press release and certain expectations regarding production volumes and increases, inventory levels, operating costs and capital spending and intensity; sales volumes; revenue, costs and earnings; supply, demand and pricing outlook in the nickel, cobalt and fertilizer markets; the availability of additional gas supplies to be used for power generation; the impact of COVID-19; Sherritt’s strategy, plans, targets and goals in respect of environmental and social governance issues, including climate change and greenhouse gas emissions reduction targets; anticipated payments and intention to settle outstanding receivables under the Cobalt Swap, including liability amounts at the implementation date, the anticipated end of historical repayment uncertainty, the anticipated repayment of all outstanding receivables through dividends, including in the form of finished cobalt or cash; and the timing, and amount of cobalt dividend distributions; distributions from the Corporation’s Moa Joint Venture in general; future receipts under the Moa Swap agreement; the impact of the U.S. sanctions on Cuba; anticipated economic conditions in Cuba; sufficiency of working capital and capital project funding; strengthening the Corporation’s capital structure and reducing annual interest expenses; and amounts of certain other commitments.
Forward-looking statements are not based on historical facts, but rather on current expectations, assumptions and projections about future events, including commodity and product prices and demand; the level of liquidity and access to funding; share price volatility; production results; realized prices for production; earnings and revenues; global demand for electric vehicles and the anticipated corresponding demand for cobalt and nickel; the commercialization of certain proprietary technologies and services; advancements in environmental and greenhouse gas (GHG) reduction technology; GHG emissions reduction goals and the anticipated timing of achieving such goals, if at all; statistics and metrics relating to Environmental, Social and Governance (ESG) matters which are based on assumptions or developing standards; environmental rehabilitation provisions; environmental risks and liabilities; compliance with applicable environmental laws and regulations; risks related to the U.S. government policy toward Cuba; and certain corporate objectives, goals and plans for 2022. By their nature, forward-looking statements require the Corporation to make assumptions and are subject to inherent risks and uncertainties. There is significant risk that predictions, forecasts, conclusions or projections will not prove to be accurate, that the assumptions may not be correct and that actual results may differ materially from such predictions, forecasts, conclusions or projections.
The Corporation cautions readers of this press release not to place undue reliance on any forward-looking statement as a number of factors could cause actual future results, conditions, actions or events to differ materially from the targets, expectations, estimates or intentions expressed in the forward-looking statements. These risks, uncertainties and other factors include, but are not limited to, the impact of infectious diseases (including the COVID-19 pandemic), the impact of global conflicts; changes in the global price for nickel, cobalt, oil, gas, fertilizers or certain other commodities; security market fluctuations and price volatility; level of liquidity and the related ability of the Moa Joint Venture to pay dividends; access to capital; access to financing; the risk to Sherritt’s entitlements to future distributions (including pursuant to the Cobalt Swap) from the Moa Joint Venture; risks related to Sherritt’s operations in Cuba; risks related to the U.S. government policy toward Cuba, including the U.S. embargo on Cuba and the Helms-Burton legislation; uncertainty about the pace of technological advancements required in relation to achieving ESG targets; identification and management of growth opportunities; risk of future non-compliance with debt restrictions and covenants; the ability to replace depleted mineral reserves; risks associated with the Corporation’s joint venture partners; variability in production at Sherritt’s operations in Cuba; risks associated with mining, processing and refining activities; potential interruptions in transportation; uncertainty of gas supply for electrical generation; reliance on key personnel and skilled workers; growth opportunity risks; the possibility of equipment and other failures; uncertainty of resources and reserve estimates; the potential for shortages of equipment and supplies, including diesel; supplies quality issues; risks related to environmental liabilities including liability for reclamation costs, tailings facility failures and toxic gas releases; risks related to the Corporation’s corporate structure; political, economic and other risks of foreign operations; risks associated with the operation of large projects generally; risks related to the accuracy of capital and operating cost estimates; foreign exchange and pricing risks; compliance with applicable environment, health and safety legislation and other associated matters; risks associated with governmental regulations regarding climate change and greenhouse gas emissions; maintaining social license to grow and operate; risks relating to community relations; credit risks; shortage of equipment and supplies; competition in product markets; future market access; interest rate changes; risks in obtaining insurance; uncertainties in labour relations; uncertainty in the ability of the Corporation to enforce legal rights in foreign jurisdictions; uncertainty regarding the interpretation and/or application of the applicable laws in foreign jurisdictions; legal contingencies; risks related to the Corporation’s accounting policies; uncertainty in the ability of the Corporation to obtain government permits; risks to information technologies systems and cybersecurity; failure to comply with, or changes to, applicable government regulations; bribery and corruption risks, including failure to comply with the Corruption of Foreign Public Officials Act or applicable local anti-corruption law; the ability to accomplish corporate objectives, goals and plans for 2022; and the ability to meet other factors listed from time to time in the Corporation’s continuous disclosure documents.
The Corporation, together with its Moa Joint Venture is pursuing a range of growth and expansion opportunities, including without limitation, process technology solutions, development projects, commercial implementation opportunities, life of mine extension opportunities and the conversion of mineral resources to reserves. In addition to the risks noted above, factors that could, alone or in combination, prevent the Corporation from successfully achieving these opportunities may include, without limitation: identifying suitable commercialization and other partners; successfully advancing discussions and successfully concluding applicable agreements with external parties and/or partners; successfully attracting required financing; successfully developing and proving technology required for the potential opportunity; successfully overcoming technical and technological challenges; successful environmental assessment and stakeholder engagement; successfully obtaining intellectual property protection; successfully completing test work and engineering studies, prefeasibility and feasibility studies, piloting, scaling from small scale to large scale production, commissioning, procurement, construction, ramp-up to commercial scale production and completion; and securing regulatory and government approvals. There can be no assurance that any opportunity will be successful, commercially viable, completed on time or on budget, or will generate any meaningful revenues, savings or earnings, as the case may be, for the Corporation. In addition, the Corporation will incur costs in pursuing any particular opportunity, which may be significant. Readers are cautioned that the foregoing list of factors is not exhaustive and should be considered in conjunction with the risk factors described in the Corporation’s other documents filed with the Canadian securities authorities, including without limitation the “Managing Risk” section of the Management’s Discussion and Analysis for the three and nine months ended September 30, 2022 and the Annual Information Form of the Corporation dated March 24, 2022 for the period ending December 31, 2021, which is available on SEDAR at www.sedar.com.
The Corporation may, from time to time, make oral forward-looking statements. The Corporation advises that the above paragraph and the risk factors described in this press release and in the Corporation’s other documents filed with the Canadian securities authorities should be read for a description of certain factors that could cause the actual results of the Corporation to differ materially from those in the oral forward-looking statements. The forward-looking information and statements contained in this press release are made as of the date hereof and the Corporation undertakes no obligation to update publicly or revise any oral or written forward-looking information or statements, whether as a result of new information, future events or otherwise, except as required by applicable securities laws. The forward-looking information and statements contained herein are expressly qualified in their entirety by this cautionary statement.
APPENDIX – NON-GAAP AND OTHER FINANCIAL MEASURES
Management uses the measures below to monitor the financial performance of the Corporation and its operating divisions and believes these measures enable investors and analysts to compare the Corporation’s financial performance with its competitors and/or evaluate the results of its underlying business. These measures are intended to provide additional information, not to replace IFRS measures, and do not have a standard definition under IFRS and should not be considered in isolation or as a substitute for measures of performance prepared in accordance with IFRS. As these measures do not have a standardized meaning, they may not be comparable to similar measures provided by other companies.
The non-GAAP and other financial measures are reconciled to the most directly comparable IFRS measure as presented in the condensed consolidated financial statements for the nine months ended September 30, 2022.
Combined revenue
The Corporation uses combined revenue as a measure to help management assess the Corporation’s financial performance across its operations. Combined revenue includes the Corporation’s consolidated revenue and revenue of the Moa Joint Venture on a 50% basis, which is accounted for using the equity method for accounting purposes.
Management uses this measure to reflect the Corporation’s economic interest in its operations prior to the application of equity accounting to help allocate financial resources and provide investors with information that it believes is useful in understanding the scope of Sherritt’s business, based on its economic interest, irrespective of the accounting treatment.
The table below reconciles combined revenue to revenue per the financial statements:
|
For the three months ended |
|
For the nine months ended |
|
||||||
|
|
2022 |
|
2021 |
|
|
2022 |
|
2021 |
|
$ millions |
September 30 |
September 30 |
Change |
September 30 |
September 30 |
Change |
||||
|
|
|
|
|
|
|
|
|
|
|
Revenue by reportable segment |
|
|
|
|
|
|
|
|
|
|
Moa Joint Venture and Fort Site(1) |
$ |
173.9 |
$ |
108.9 |
60% |
$ |
565.2 |
$ |
377.4 |
50% |
Metals Other |
|
2.1 |
|
1.3 |
62% |
|
6.4 |
|
4.7 |
36% |
Oil and Gas |
|
4.7 |
|
2.2 |
114% |
|
13.7 |
|
10.9 |
26% |
Power |
|
9.0 |
|
7.3 |
23% |
|
26.6 |
|
20.2 |
32% |
Technologies |
|
0.2 |
|
0.2 |
- |
|
1.3 |
|
0.4 |
225% |
Corporate |
|
0.2 |
|
0.3 |
(33%) |
|
0.6 |
|
0.6 |
- |
Combined revenue |
$ |
190.1 |
$ |
120.2 |
58% |
$ |
613.8 |
$ |
414.2 |
48% |
Adjustment for Moa Joint Venture |
|
(159.9) |
|
(99.5) |
|
|
(483.6) |
|
(340.6) |
|
Financial statement revenue |
$ |
30.2 |
$ |
20.7 |
46% |
$ |
130.2 |
$ |
73.6 |
77% |
(1) |
Revenue of Moa Joint Venture and Fort Site for the three months ended September 30, 2022 is composed of revenue recognized by the Moa Joint Venture of $159.9 million (50% basis), which is equity-accounted and included in share of earnings of Moa Joint Venture, net of tax, and revenue recognized by Fort Site of $14.0 million, which is included in consolidated revenue (for the three months ended September 30, 2021 - $99.5 million and $9.4 million, respectively). Revenue of Moa Joint Venture and Fort Site for the nine months ended September 30, 2022 is composed of revenue recognized by the Moa Joint Venture of $483.6 million (50% basis), which is equity-accounted and included in share of earnings of Moa Joint Venture, net of tax, and revenue recognized by Fort Site of $81.6 million, which is included in consolidated revenue (for the three months ended September 30, 2021 - $340.6 million and $36.8 million, respectively). |
Adjusted EBITDA
The Corporation defines Adjusted EBITDA as earnings (loss) from operations and joint venture, which excludes net finance expense and loss from discontinued operations, net of tax, as reported in the financial statements for the period, adjusted for: depletion, depreciation and amortization; impairment losses on non-current non-financial assets and investments; and gains or losses on disposal of property, plant and equipment of the Corporation and the Moa Joint Venture. The exclusion of impairment losses eliminates the non-cash impact of the losses.
Management uses Adjusted EBITDA internally to evaluate the cash generation potential of Sherritt’s operating divisions on a combined and segment basis as an indicator of ability to fund working capital needs, meet covenant obligations, service debt and fund capital expenditures, as well as provide a level of comparability to similar entities. Management believes that Adjusted EBITDA provides useful information to investors in evaluating the Corporation’s operating results in the same manner as management and the Board of Directors.
The tables below reconcile earnings (loss) from operations and joint venture per the financial statements to Adjusted EBITDA:
$ millions, for the three months ended September 30 |
|
|
|
|
|
|
|
|
|
|
|
2022 |
||||
|
|
|
|
|
|
|
Adjustment |
|
||||||||
|
|
|
|
|
|
|
|
|
|
|
|
|
for Moa |
|
|
|
|
Moa JV and |
Metals |
Oil and |
|
Techno- |
|
Joint |
|
||||||||
|
Fort Site(1) |
Other |
Gas |
Power |
logies |
Corporate |
Venture |
Total |
||||||||
|
|
|
|
|
|
|
|
|
|
|
|
|
|
|
|
|
Earnings (loss) from operations and joint venture |
|
|
|
|
|
|
|
|
|
|
|
|
|
|
||
per financial statements |
$ |
23.1 |
$ |
(0.6) |
$ |
1.5 |
$ |
1.4 |
$ |
(3.5) |
$ |
(1.1) |
$ |
0.5 |
$ |
21.3 |
Add (deduct): |
|
|
|
|
|
|
|
|
|
|
|
|
|
|
|
|
Depletion, depreciation and amortization |
|
2.0 |
|
0.1 |
|
0.1 |
|
4.1 |
|
- |
|
0.1 |
|
- |
|
6.4 |
Adjustments for share of earnings of Moa Joint Venture: |
|
|
|
|
|
|
|
|
|
|
|
|
|
|
|
|
Depletion, depreciation and amortization |
|
10.2 |
|
- |
|
- |
|
- |
|
- |
|
- |
|
- |
|
10.2 |
Net finance expense |
|
- |
|
- |
|
- |
|
- |
|
- |
|
- |
|
1.8 |
|
1.8 |
Income tax recovery |
|
- |
|
- |
|
- |
|
- |
|
- |
|
- |
|
(2.3) |
|
(2.3) |
Adjusted EBITDA |
$ |
35.3 |
$ |
(0.5) |
$ |
1.6 |
$ |
5.5 |
$ |
(3.5) |
$ |
(1.0) |
$ |
- |
$ |
37.4 |
|
|
|
|
|
|
|
|
|
|
|
|
|
|
|
|
|
$ millions, for the three months ended September 30 |
|
|
|
|
|
|
|
|
|
|
|
2021 |
||||
|
|
|
|
|
|
|
Adjustment |
|
||||||||
|
|
|
|
|
|
|
|
|
|
|
|
|
for Moa |
|
|
|
|
Moa JV and |
Metals |
Oil and |
|
Techno- |
|
Joint |
|
||||||||
|
Fort Site(1) |
Other |
Gas |
Power |
logies |
Corporate |
Venture |
Total |
||||||||
|
|
|
|
|
|
|
|
|
|
|
|
|
|
|
|
|
Earnings (loss) from operations and joint venture |
|
|
|
|
|
|
|
|
|
|
|
|
|
|
||
per financial statements |
$ |
14.6 |
$ |
(0.5) |
$ |
(2.0) |
$ |
0.2 |
$ |
(2.8) |
$ |
(8.8) |
$ |
(11.5) |
$ |
(10.8) |
Add (deduct): |
|
|
|
|
|
|
|
|
|
|
|
|
|
|
|
|
Depletion, depreciation and amortization |
|
2.6 |
|
0.1 |
|
1.3 |
|
3.9 |
|
- |
|
0.3 |
|
- |
|
8.2 |
Gain on disposal of property, plant and equipment |
|
- |
|
- |
|
(1.2) |
|
- |
|
- |
|
|
|
- |
|
(1.2) |
Adjustments for share of earnings of Moa Joint Venture: |
|
|
|
|
|
|
|
|
|
|
|
|
|
|
|
|
Depletion, depreciation and amortization |
|
9.9 |
|
- |
|
- |
|
- |
|
- |
|
- |
|
- |
|
9.9 |
Net finance expense |
|
- |
|
- |
|
- |
|
- |
|
- |
|
- |
|
1.6 |
|
1.6 |
Income tax expense |
|
- |
|
- |
|
- |
|
- |
|
- |
|
- |
|
9.9 |
|
9.9 |
Adjusted EBITDA |
$ |
27.1 |
$ |
(0.4) |
$ |
(1.9) |
$ |
4.1 |
$ |
(2.8) |
$ |
(8.5) |
$ |
- |
$ |
17.6 |
|
|
|
|
|
|
|
|
|
|
|
|
|
|
|
|
|
$ millions, for the nine months ended September 30 |
|
|
|
|
|
|
|
|
|
|
|
2022 |
||||
|
|
|
|
|
|
|
Adjustment |
|
||||||||
|
|
|
|
|
|
|
|
|
|
|
|
|
for Moa |
|
|
|
|
Moa JV and |
Metals |
Oil and |
|
Techno- |
|
Joint |
|
||||||||
|
Fort Site(2) |
Other |
Gas |
Power |
logies |
Corporate |
Venture |
Total |
||||||||
|
|
|
|
|
|
|
|
|
|
|
|
|
|
|
|
|
Earnings (loss) from operations and joint venture |
|
|
|
|
|
|
|
|
|
|
|
|
|
|
||
per financial statements |
$ |
169.2 |
$ |
(1.8) |
$ |
0.8 |
$ |
4.2 |
$ |
(10.4) |
$ |
(15.8) |
$ |
(27.4) |
$ |
118.8 |
Add (deduct): |
|
|
|
|
|
|
|
|
|
|
|
|
|
|
|
|
Depletion, depreciation and amortization |
|
7.4 |
|
0.1 |
|
0.8 |
|
12.0 |
|
0.1 |
|
0.8 |
|
- |
|
21.2 |
Gain on disposal of property, plant and equipment |
|
- |
|
- |
|
(1.3) |
|
- |
|
- |
|
- |
|
- |
|
(1.3) |
Adjustments for share of earnings of Moa Joint Venture: |
|
|
|
|
|
|
|
|
|
|
|
|
|
|
|
|
Depletion, depreciation and amortization |
|
31.8 |
|
- |
|
- |
|
- |
|
- |
|
- |
|
- |
|
31.8 |
Net finance expense |
|
- |
|
- |
|
- |
|
- |
|
- |
|
- |
|
6.7 |
|
6.7 |
Income tax expense |
|
- |
|
- |
|
- |
|
- |
|
- |
|
- |
|
20.7 |
|
20.7 |
Adjusted EBITDA |
$ |
208.4 |
$ |
(1.7) |
$ |
0.3 |
$ |
16.2 |
$ |
(10.3) |
$ |
(15.0) |
$ |
- |
$ |
197.9 |
|
|
|
|
|
|
|
|
|
|
|
|
|
|
|
|
|
$ millions, for the nine months ended September 30 |
|
|
|
|
|
|
|
|
|
|
|
|
|
|
|
2021 |
|
|
|
|
|
|
|
Adjustment |
|
||||||||
|
|
|
|
|
|
|
|
|
|
|
|
|
for Moa |
|
|
|
|
Moa JV and |
Metals |
Oil and |
|
Techno- |
|
Joint |
|
||||||||
|
Fort Site(2) |
Other |
Gas |
Power |
logies |
Corporate |
Venture |
Total |
||||||||
|
|
|
|
|
|
|
|
|
|
|
|
|
|
|
|
|
Earnings (loss) from operations and joint venture |
|
|
|
|
|
|
|
|
|
|
|
|
|
|
||
per financial statements |
$ |
62.1 |
$ |
(1.6) |
$ |
(10.9) |
$ |
(1.1) |
$ |
(9.0) |
$ |
(31.6) |
$ |
(19.9) |
$ |
(12.0) |
Add (deduct): |
|
|
|
|
|
|
|
|
|
|
|
|
|
|
|
|
Depletion, depreciation and amortization |
|
8.3 |
|
0.2 |
|
5.6 |
|
11.7 |
|
0.1 |
|
0.7 |
|
- |
|
26.6 |
Gain on disposal of property, plant and equipment |
|
- |
|
- |
|
(1.2) |
|
- |
|
- |
|
- |
|
- |
|
(1.2) |
Adjustments for share of earnings of Moa Joint Venture: |
|
|
|
|
|
|
|
|
|
|
|
|
|
|
|
|
Depletion, depreciation and amortization |
|
32.5 |
|
- |
|
- |
|
- |
|
- |
|
- |
|
- |
|
32.5 |
Net finance income |
|
- |
|
- |
|
- |
|
- |
|
- |
|
- |
|
(0.7) |
|
(0.7) |
Income tax expense |
|
- |
|
- |
|
- |
|
- |
|
- |
|
- |
|
20.6 |
|
20.6 |
Adjusted EBITDA |
$ |
102.9 |
$ |
(1.4) |
$ |
(6.5) |
$ |
10.6 |
$ |
(8.9) |
$ |
(30.9) |
$ |
- |
$ |
65.8 |
(1) |
|
Adjusted EBITDA of Moa Joint Venture and Fort Site for the three months ended September 30, 2022 is composed of Adjusted EBITDA at Moa Joint Venture of $31.5 million (50% basis) and Adjusted EBITDA at Fort Site of $3.8 million (for the three months ended September 30, 2021 - $28.7 million and $(1.6) million, respectively). |
(2) |
|
Adjusted EBITDA of Moa Joint Venture and Fort Site for the nine months ended September 30, 2022 is composed of Adjusted EBITDA at Moa Joint Venture of $176.4 million (50% basis) and Adjusted EBITDA at Fort Site of $32.0 million (for the nine months ended September 30, 2021 - $105.5 million and $(2.6) million, respectively). |
Average-realized price
Average-realized price is generally calculated by dividing revenue by sales volume for the given product in a given division. The average-realized price for power excludes by-product revenue, as this revenue is not earned directly for power generation. Transactions by a Moa Joint Venture marketing company, included in other revenue, are excluded.
Management uses this measure, and believes investors use this measure, to compare the relationship between the revenue per unit and direct costs on a per unit basis in each reporting period for nickel, cobalt, fertilizer and power and provide comparability with other similar external operations.
Average-realized price for fertilizer is the weighted-average realized price of ammonia and various ammonium sulphate products.
Average-realized price for nickel and cobalt are expressed in Canadian dollars per pound sold, while fertilizer is expressed in Canadian dollars per tonne sold and electricity is expressed in Canadian dollars per megawatt hour sold.
The tables below reconcile revenue per the financial statements to average-realized price:
|
|
|
|
|
|
|
|
|
|
|
|
|
|
|
$ millions, except average-realized price and sales volume, for the three months ended September 30 |
|
|
|
|
|
|
|
2022 |
||||||
|
Moa Joint Venture and Fort Site |
|
|
|
|
|
|
|
|
|||||
|
|
|
|
|
|
|
|
|
|
|
Adjustment |
|
|
|
|
|
|
|
|
|
|
|
for Moa Joint |
|
|||||
|
Nickel |
Cobalt |
Fertilizer |
Power |
|
Other(1) |
Venture |
|
Total |
|||||
|
|
|
|
|
|
|
|
|
|
|
|
|
|
|
Revenue per financial statements |
$ |
128.0 |
$ |
21.5 |
$ |
15.0 |
$ |
9.0 |
$ |
16.6 |
$ |
(159.9) |
$ |
30.2 |
Adjustments to revenue: |
|
|
|
|
|
|
|
|
|
|
|
|
|
|
By-product revenue |
|
- |
|
- |
|
- |
|
(1.1) |
|
|
|
|
|
|
Revenue for purposes of average-realized price calculation |
|
128.0 |
|
21.5 |
|
15.0 |
|
7.9 |
|
|
|
|
|
|
|
|
|
|
|
|
|
|
|
|
|
|
|
|
|
Sales volume for the period |
|
9.9 |
|
0.8 |
|
27.4 |
|
139 |
|
|
|
|
|
|
Volume units |
Millions of |
Millions of |
Thousands |
Gigawatt |
|
|
|
|
|
|||||
|
pounds |
|
pounds |
|
of tonnes |
|
hours |
|
|
|
|
|
|
|
Average-realized price(2)(3)(4) |
$ |
12.94 |
$ |
28.21 |
$ |
531.10 |
$ |
57.02 |
|
|
|
|
|
|
$ millions, except average-realized price and sales volume, for the three months ended September 30 |
|
|
|
|
|
|
|
2021 |
||||||
|
Moa Joint Venture and Fort Site |
|
|
|
|
|
|
|
|
|||||
|
|
|
|
|
|
|
|
|
|
|
Adjustment |
|
|
|
|
|
|
|
|
|
|
|
for Moa Joint |
|
|||||
|
Nickel |
Cobalt |
Fertilizer |
Power |
|
Other(1) |
Venture |
|
Total |
|||||
|
|
|
|
|
|
|
|
|
|
|
|
|
|
|
Revenue per financial statements |
$ |
70.9 |
$ |
22.2 |
$ |
10.9 |
$ |
7.3 |
$ |
8.9 |
$ |
(99.5) |
$ |
20.7 |
Adjustments to revenue: |
|
|
|
|
|
|
|
|
|
|
|
|
|
|
By-product revenue |
|
- |
|
- |
|
- |
|
(1.2) |
|
|
|
|
|
|
Revenue for purposes of average-realized price calculation |
|
70.9 |
|
22.2 |
|
10.9 |
|
6.1 |
|
|
|
|
|
|
|
|
|
|
|
|
|
|
|
|
|
|
|
|
|
Sales volume for the period |
|
6.6 |
|
0.8 |
|
25.2 |
|
110 |
|
|
|
|
|
|
Volume units |
Millions of |
Millions of |
Thousands |
Gigawatt |
|
|
|
|
|
|
||||
|
pounds |
|
pounds |
|
of tonnes |
|
hours |
|
|
|
|
|
|
|
Average-realized price(2)(3)(4) |
$ |
10.76 |
$ |
27.03 |
$ |
432.63 |
$ |
54.57 |
|
|
|
|
|
|
$ millions, except average-realized price and sales volume, for the nine months ended September 30 |
|
|
|
|
|
|
|
2022 |
||||||
|
Moa Joint Venture and Fort Site |
|
|
|
|
|
|
|
|
|||||
|
|
|
|
|
|
|
|
|
|
|
Adjustment |
|
|
|
|
|
|
|
|
|
|
|
for Moa Joint |
|
|
||||
|
Nickel |
Cobalt |
Fertilizer |
|
Power |
|
Other |
Venture |
Total |
|||||
|
|
|
|
|
|
|
|
|
|
|
|
|
|
|
Revenue per financial statements |
$ |
369.0 |
$ |
82.2 |
$ |
89.6 |
$ |
26.6 |
$ |
40.7 |
$ |
(483.6) |
$ |
124.5 |
Adjustments to revenue: |
|
|
|
|
|
|
|
|
|
|
|
|
|
|
Third-party finished nickel revenue |
|
(14.1) |
|
- |
|
- |
|
- |
|
|
|
|
|
|
By-product revenue |
|
- |
|
- |
|
- |
|
(3.9) |
|
|
|
|
|
|
Revenue for purposes of average-realized price calculation |
|
354.9 |
|
82.2 |
|
89.6 |
|
22.7 |
|
|
|
|
|
|
|
|
|
|
|
|
|
|
|
|
|
|
|
|
|
Sales volume for the period |
|
25.1 |
|
2.2 |
|
108.8 |
|
409 |
|
|
|
|
|
|
Volume units |
Millions of |
Millions of |
Thousands
|
Gigawatt |
|
|
|
|
|
|||||
|
pounds |
|
pounds |
|
of tonnes |
|
hours |
|
|
|
|
|
|
|
Average-realized price(1)(2)(3) |
$ |
14.69 |
$ |
37.59 |
$ |
823.91 |
$ |
55.67 |
|
|
|
|
|
|
$ millions, except average-realized price and sales volume, for the nine months ended September 30 |
|
|
|
|
|
|
|
2021 |
||||||
|
Moa Joint Venture and Fort Site |
|
|
|
|
|
|
|
|
|||||
|
|
|
|
|
|
|
|
|
|
|
Adjustment |
|
|
|
|
|
|
|
|
|
|
|
for Moa Joint |
|
|||||
|
Nickel |
Cobalt |
Fertilizer |
|
Power |
|
Other(1) |
Venture |
|
Total |
||||
|
|
|
|
|
|
|
|
|
|
|
|
|
|
|
Revenue per financial statements |
$ |
251.7 |
$ |
67.9 |
$ |
45.8 |
$ |
20.2 |
$ |
28.6 |
$ |
(340.6) |
$ |
73.6 |
Adjustments to revenue: |
|
|
|
|
|
|
|
|
|
|
|
|
|
|
By-product revenue |
|
- |
|
- |
|
- |
|
(2.9) |
|
|
|
|
|
|
Revenue for purposes of average-realized price calculation |
|
251.7 |
|
67.9 |
|
45.8 |
|
17.3 |
|
|
|
|
|
|
|
|
|
|
|
|
|
|
|
|
|
|
|
|
|
Sales volume for the period |
|
25.2 |
|
2.9 |
|
117.0 |
|
320 |
|
|
|
|
|
|
Volume units |
Millions of |
Millions of |
Thousands |
Gigawatt |
|
|
|
|
||||||
|
pounds |
|
pounds |
|
of tonnes |
|
hours |
|
|
|
|
|
|
|
Average-realized price(2)(3)(4) |
$ |
9.99 |
$ |
23.69 |
$ |
391.73 |
$ |
53.93 |
|
|
|
|
|
|
(1) |
|
Other revenue includes revenue from the Metals Other, Oil and Gas, Technologies and Corporate reportable segments. |
(2) |
|
Average-realized price may not calculate exactly based on amounts presented due to foreign exchange and rounding. |
(3) |
|
Power, average-realized price per MWh. |
(4) |
|
Fertilizer, average-realized price per tonne. |
Unit operating cost/NDCC
With the exception of the Moa Joint Venture, which uses NDCC, unit operating cost is generally calculated by dividing cost of sales as reported in the financial statements, less depreciation, depletion and amortization in cost of sales, the impact of impairment losses, gains and losses on disposal of property, plant, and equipment and exploration and evaluation assets and certain other non-production related costs, by the number of units sold.
The Moa Joint Venture’s NDCC is calculated by dividing cost of sales, as reported in the financial statements, adjusted for the following: depreciation, depletion, amortization and impairment losses in cost of sales; cobalt by-product, fertilizer and other revenue; and other costs primarily related to the impact of opening and closing inventory values, by the number of finished nickel pounds sold in the period, expressed in U.S. dollars.
Unit operating costs for nickel and electricity are key measures that management and investors uses to monitor performance. NDCC of nickel is a widely-used performance measure for nickel producers. Management uses unit operating costs/NDCC to assess how well the Corporation’s producing mine and power facilities are performing and to assess overall production efficiency and effectiveness internally across periods and compared to its competitors.
Unit operating cost (NDCC) for nickel is expressed in U.S. dollars per pound sold, while electricity is expressed in Canadian dollars per megawatt hour sold.
The tables below reconcile cost of sales per the financial statements to unit operating cost/NDCC:
|
|
|
|
|
|
|
|
|
|
|
$ millions, except unit cost and sales volume, for the three months ended September 30 |
|
|
|
|
|
|
|
2022 |
||
|
|
|
|
|
|
|
|
Adjustment |
|
|
|
Moa JV and |
|
|
|
|
|
for Moa |
|
|
|
|
Fort Site |
|
Power |
|
Other(1) |
|
Joint Venture |
|
Total |
|
|
|
|
|
|
|
|
|
|
|
|
Cost of sales per financial statements |
$ |
148.3 |
$ |
6.8 |
$ |
9.1 |
$ |
(137.2) |
$ |
27.0 |
Less: |
|
|
|
|
|
|
|
|
|
|
Depletion, depreciation and amortization in cost of sales |
|
(12.2) |
|
(4.1) |
|
|
|
|
|
|
|
|
136.1 |
|
2.7 |
|
|
|
|
|
|
Adjustments to cost of sales: |
|
|
|
|
|
|
|
|
|
|
Cobalt by-product, fertilizer and other revenue |
|
(45.9) |
|
- |
|
|
|
|
|
|
Impact of opening/closing inventory and other(2) |
|
(3.1) |
|
- |
|
|
|
|
|
|
Cost of sales for purposes of unit cost calculation |
|
87.1 |
|
2.7 |
|
|
|
|
|
|
|
|
|
|
|
|
|
|
|
|
|
Sales volume for the period |
|
9.9 |
|
139 |
|
|
|
|
|
|
Volume units |
Millions of |
Gigawatt |
|
|
|
|
||||
|
pounds |
|
hours |
|
|
|
|
|
|
|
Unit operating cost(3)(4) |
$ |
8.81 |
$ |
20.04 |
|
|
|
|
|
|
Unit operating cost (US$ per pound) (NDCC)(5) |
$ |
6.76 |
|
|
|
|
|
|
|
|
$ millions, except unit cost and sales volume, for the three months ended September 30 |
|
|
|
|
|
|
|
2021 |
||
|
|
|
|
|
|
|
|
Adjustment |
|
|
|
Moa JV and |
|
|
|
|
|
for Moa |
|
|
|
|
Fort Site |
|
Power |
|
Other(1) |
|
Joint Venture |
|
Total |
|
|
|
|
|
|
|
|
|
|
|
|
Cost of sales per financial statements |
$ |
92.1 |
$ |
6.5 |
$ |
8.4 |
$ |
(79.3) |
$ |
27.7 |
Less: |
|
|
|
|
|
|
|
|
|
|
Depletion, depreciation and amortization in cost of sales |
|
(12.5) |
|
(3.9) |
|
|
|
|
|
|
|
|
79.6 |
|
2.6 |
|
|
|
|
|
|
Adjustments to cost of sales: |
|
|
|
|
|
|
|
|
|
|
Cobalt by-product, fertilizer and other revenue |
|
(38.0) |
|
- |
|
|
|
|
|
|
Impact of opening/closing inventory and other(2) |
|
(3.7) |
|
- |
|
|
|
|
|
|
Cost of sales for purposes of unit cost calculation |
|
37.9 |
|
2.6 |
|
|
|
|
|
|
|
|
|
|
|
|
|
|
|
|
|
Sales volume for the period |
|
6.6 |
|
110 |
|
|
|
|
|
|
Volume units |
Millions of |
Gigawatt |
|
|
|
|
||||
|
pounds |
|
hours |
|
|
|
|
|
|
|
Unit operating cost(3)(4) |
$ |
5.75 |
$ |
23.14 |
|
|
|
|
|
|
Unit operating cost (US$ per pound) (NDCC)(5) |
$ |
4.53 |
|
|
|
|
|
|
|
|
$ millions, except unit cost and sales volume, for the nine months ended September 30 |
|
|
|
|
|
|
|
2022 |
||
|
|
|
|
|
|
|
|
Adjustment |
|
|
|
Moa JV and |
|
|
|
|
|
for Moa |
|
|
|
|
Fort Site |
|
Power |
|
Other(1) |
|
Joint Venture |
|
Total |
|
|
|
|
|
|
|
|
|
|
|
|
Cost of sales per financial statements |
$ |
390.0 |
$ |
19.3 |
$ |
31.6 |
$ |
(334.9) |
$ |
106.0 |
Less: |
|
|
|
|
|
|
|
|
|
|
Depletion, depreciation and amortization in cost of sales |
|
(39.2) |
|
(12.0) |
|
|
|
|
|
|
|
|
350.8 |
|
7.3 |
|
|
|
|
|
|
Adjustments to cost of sales: |
|
|
|
|
|
|
|
|
|
|
Cobalt by-product, fertilizer and other revenue |
|
(196.2) |
|
- |
|
|
|
|
|
|
Impact of opening/closing inventory and other(2) |
|
(13.4) |
|
- |
|
|
|
|
|
|
Cost of sales for purposes of unit cost calculation |
|
141.2 |
|
7.3 |
|
|
|
|
|
|
|
|
|
|
|
|
|
|
|
|
|
Sales volume for the period |
|
25.1 |
|
409 |
|
|
|
|
|
|
Volume units |
Millions of |
Gigawatt |
|
|
|
|
||||
|
pounds |
|
hours |
|
|
|
|
|
|
|
Unit operating cost(3)(4) |
$ |
5.62 |
$ |
18.60 |
|
|
|
|
|
|
Unit operating cost (US$ per pound) (NDCC)(5) |
$ |
4.39 |
|
|
|
|
|
|
|
|
$ millions, except unit cost and sales volume, for the nine months ended September 30 |
|
|
|
|
|
|
|
2021 |
||
|
|
|
|
|
|
|
|
Adjustment |
|
|
|
Moa JV and |
|
|
|
|
|
for Moa |
|
|
|
|
Fort Site |
|
Power |
|
Other(1) |
|
Joint Venture |
|
Total |
|
|
|
|
|
|
|
|
|
|
|
|
Cost of sales per financial statements |
$ |
308.7 |
$ |
19.1 |
$ |
34.3 |
$ |
(263.7) |
$ |
98.4 |
Less: |
|
|
|
|
|
|
|
|
|
|
Depletion, depreciation and amortization in cost of sales |
|
(40.8) |
|
(11.7) |
|
|
|
|
|
|
|
|
267.9 |
|
7.4 |
|
|
|
|
|
|
Adjustments to cost of sales: |
|
|
|
|
|
|
|
|
|
|
Cobalt by-product, fertilizer and other revenue |
|
(125.7) |
|
- |
|
|
|
|
|
|
Impact of opening/closing inventory and other(2) |
|
(6.8) |
|
- |
|
|
|
|
|
|
Impairment on assets |
|
- |
|
- |
|
|
|
|
|
|
Cost of sales for purposes of unit cost calculation |
|
135.4 |
|
7.4 |
|
|
|
|
|
|
|
|
|
|
|
|
|
|
|
|
|
Sales volume for the period |
|
25.2 |
|
320 |
|
|
|
|
|
|
Volume units |
Millions of |
Gigawatt |
|
|
|
|
||||
|
pounds |
|
hours |
|
|
|
|
|
|
|
Unit operating cost(3)(4) |
$ |
5.37 |
$ |
23.19 |
|
|
|
|
|
|
Unit operating cost (US$ per pound) (NDCC)(5) |
$ |
4.30 |
|
|
|
|
|
|
|
|
(1) |
|
Other is composed of the cost of sales of the Metals Other, Oil and Gas and Technologies reportable segments. |
(2) |
|
Other is primarily composed of royalties and other contributions, sales discounts and other non-cash items. |
(3) |
|
Unit operating cost/NDCC may not calculate exactly based on amounts presented due to foreign exchange and rounding. |
(4) |
|
Power, unit operating cost price per MWh. |
(5) |
|
Unit operating costs in US$ are converted at the average exchange rate for the period. |
Adjusted net earnings/loss from continuing operations and adjusted net earnings/loss from continuing operations per share
The Corporation defines adjusted net earnings/loss from continuing operations as net earnings/loss from continuing operations less items not reflective of operational performance. These adjusting items include, but are not limited to, inventory obsolescence, impairment of assets, gains and losses on the acquisition or disposal of assets, unrealized foreign exchange gains and losses, gains and losses on financial assets and liabilities and other one-time adjustments. While some adjustments are recurring (such as unrealized foreign exchange (gain) loss and revaluations of allowances for expected credit losses (ACL)), management believes that they do not reflect the Corporation’s operational performance or future operational performance. Adjusted net earnings/loss from continuing operations per share is defined consistent with the definition above and divided by the Corporation’s weighted-average number of common shares outstanding.
Management uses these measures internally and believes that they provide investors with performance measures with which to assess the Corporation’s core operations by adjusting for items or transactions that are not reflective of its core operating activities.
The table below reconcile net earnings (loss) from continuing operations and net earnings (loss) from continuing operations per share, both per the financial statements, to adjusted net earnings (loss) from continuing operations and adjusted net earnings (loss) from continuing operations per share, respectively:
|
|
|
|
2022 |
|
|
|
2021 |
For the three months ended September 30 |
$ millions |
$/share |
$ millions |
$/share |
||||
|
|
|
|
|
|
|
|
|
Net (loss) earnings from continuing operations |
$ |
(26.9) |
$ |
(0.07) |
$ |
(15.5) |
$ |
(0.04) |
|
|
|
|
|
|
|
|
|
Adjusting items: |
|
|
|
|
|
|
|
|
Sherritt - Unrealized foreign exchange (gain) loss - continuing operations |
|
(4.6) |
|
(0.01) |
|
7.9 |
|
0.02 |
Corporate - Severance and other contractual benefits expense |
|
- |
|
- |
|
3.1 |
|
0.01 |
Corporate - Unrealized losses on commodity put options |
|
- |
|
- |
|
(1.3) |
|
- |
Corporate - Realized loss on commodity put options |
|
- |
|
- |
|
1.7 |
|
0.01 |
Moa Joint Venture - Inventory obsolescence |
|
0.1 |
|
- |
|
1.3 |
|
- |
Fort Site - Inventory obsolescence |
|
- |
|
- |
|
1.0 |
|
- |
Oil and Gas - Gain on disposal of property, plant and equipment |
|
- |
|
- |
|
(1.2) |
|
- |
Oil and Gas - Realized foreign exchange gain due to Cuban currency unification |
|
- |
|
- |
|
(10.0) |
|
(0.03) |
Oil and Gas and Power - trade accounts receivable, net ACL revaluation |
|
(1.1) |
|
- |
|
(1.4) |
|
- |
Power - Energas conditional sales agreement ACL revaluation(1) |
|
48.5 |
|
0.12 |
|
- |
|
- |
Other(2) |
|
- |
|
- |
|
0.7 |
|
- |
Total adjustments, before tax |
$ |
42.9 |
$ |
0.11 |
$ |
1.8 |
$ |
0.01 |
Tax adjustments |
|
(2.1) |
|
(0.01) |
|
0.3 |
|
- |
Adjusted net earnings (loss) from continuing operations |
$ |
13.9 |
$ |
0.03 |
$ |
(13.4) |
$ |
(0.03) |
(1) |
|
Primarily related to a non-cash loss on revaluation of the ACL on the Energas CSA receivable as a result of the Cobalt Swap signed by the Corporation subsequent to period end and, in part, due to the suspension of interest over the five-year period of the agreement. |
(2) |
|
Other items primarily relate to losses in net finance (expense) income. |
|
|
|
|
|||||
|
|
|
|
2022 |
|
|
|
2021 |
For the nine months ended September 30 |
$ millions |
$/share |
$ millions |
$/share |
||||
|
|
|
|
|
|
|
|
|
Net earnings (loss) from continuing operations |
$ |
71.0 |
$ |
0.18 |
$ |
(27.8) |
$ |
(0.07) |
|
|
|
|
|
|
|
|
|
Adjusting items: |
|
|
|
|
|
|
|
|
Sherritt - Unrealized foreign exchange gain - continuing operations |
|
(9.5) |
|
(0.02) |
|
(3.3) |
|
(0.01) |
Corporate - Gain on repurchase of notes |
|
(13.8) |
|
(0.03) |
|
(2.1) |
|
(0.01) |
Corporate - Transaction finance charges on repurchase of notes |
|
1.2 |
|
- |
|
- |
|
- |
Corporate - Severance and other contractual benefits expense |
|
- |
|
- |
|
5.5 |
|
0.02 |
Corporate - Unrealized losses on commodity put options |
|
(0.9) |
|
- |
|
3.0 |
|
0.01 |
Corporate - Realized losses on commodity put options |
|
0.9 |
|
- |
|
2.5 |
|
0.01 |
Moa Joint Venture - Inventory obsolescence |
|
0.5 |
|
- |
|
1.3 |
|
- |
Fort Site - Inventory obsolescence |
|
- |
|
- |
|
1.2 |
|
- |
Oil and Gas - Gain on disposal of property, plant and equipment |
|
(1.3) |
|
- |
|
(1.2) |
|
- |
Oil and Gas - Realized foreign exchange gain due to Cuban currency unification |
|
- |
|
- |
|
(10.0) |
|
(0.03) |
Oil and Gas and Power - trade accounts receivable, net ACL revaluation |
|
0.4 |
|
- |
|
0.1 |
|
- |
Power - Energas conditional sales agreement ACL revaluation(1) |
|
49.0 |
|
0.12 |
|
2.7 |
|
0.01 |
Other(2) |
|
- |
|
- |
|
(0.4) |
|
- |
Total adjustments, before tax |
$ |
26.5 |
$ |
0.07 |
$ |
(0.7) |
$ |
- |
Tax adjustments |
|
(2.5) |
|
(0.01) |
|
(0.2) |
|
- |
Adjusted net earnings (loss) from continuing operations |
$ |
95.0 |
$ |
0.24 |
$ |
(28.7) |
$ |
(0.07) |
(1) |
|
Primarily related to a non-cash loss on revaluation of the ACL on the Energas CSA receivable as a result of the Cobalt Swap signed by the Corporation subsequent to period end and, in part, due to the suspension of interest over the five-year period of the agreement. |
(2) |
|
Other items primarily relate to losses in net finance (expense) income. |
Spending on capital
The Corporation defines spending on capital for each segment as property, plant and equipment and intangible asset expenditures on a cash basis adjusted to the accrual basis in order to account for assets that are available for use by the Corporation and the Moa Joint Venture prior to payment and includes adjustments to accruals. The Moa Joint Venture and Fort Site segment’s spending on capital includes the Fort Site’s expenditures, plus the Corporation’s 50% share of the Moa Joint Venture’s expenditures, which is accounted for using the equity method for accounting purposes.
Combined spending on capital is the aggregate of each segment’s spending on capital or the Corporation’s consolidated property, plant and equipment and intangible asset expenditures and the property, plant and equipment and intangible asset expenditures of the Moa Joint Venture on a 50% basis, all adjusted to the accrual basis.
Combined spending on capital is used by management, and management believes this information is used by investors, to analyze the Corporation and the Moa Joint Venture’s investments in non-current assets that are held for use in the production of nickel, cobalt, fertilizers, oil and gas and power generation.
The tables below reconcile property, plant and equipment and intangible asset expenditures per the financial statements to combined spending on capital, expressed in Canadian dollars:
|
|
|
|
|
|
|
|
|
|
|
|
|
$ millions, for the three months ended September 30 |
|
|
|
|
|
|
|
|
|
2022 |
||
|
|
|
|
|
|
|
|
|
|
|
|
Total |
|
|
|
|
|
|
|
|
|
|
Adjustment |
|
derived from |
|
Moa JV and |
|
|
|
|
|
Combined |
|
for Moa |
|
financial |
|
|
Fort Site |
|
Power |
|
Other(1) |
|
total |
|
Joint Venture |
|
statements |
|
|
|
|
|
|
|
|
|
|
|
|
|
|
Property, plant and equipment expenditures(2) |
$ |
17.4 |
$ |
3.0 |
$ |
0.1 |
$ |
20.5 |
$ |
(10.1) |
$ |
10.4 |
Intangible asset expenditures(2) |
|
- |
|
- |
|
- |
|
- |
|
- |
|
- |
|
|
17.4 |
|
3.0 |
|
0.1 |
|
20.5 |
$ |
(10.1) |
$ |
10.4 |
|
|
|
|
|
|
|
|
|
|
|
|
|
Adjustments: |
|
|
|
|
|
|
|
|
|
|
|
|
Accrual adjustment |
|
0.7 |
|
- |
|
- |
|
0.7 |
|
|
|
|
Spending on capital |
$ |
18.1 |
$ |
3.0 |
$ |
0.1 |
$ |
21.2 |
|
|
|
|
|
|
|
|
|
|
|
|
|
|
|
|
|
$ millions, for the three months ended September 30 |
|
|
|
|
|
|
|
|
|
2021 |
||
|
|
|
|
|
|
|
|
|
|
|
|
Total |
|
|
|
|
|
|
|
|
|
|
Adjustment |
|
derived from |
|
Moa JV and |
|
|
|
|
|
Combined |
|
for Moa |
|
financial |
|
|
Fort Site |
|
Power |
|
Other(1) |
|
total |
|
Joint Venture |
|
statements |
|
|
|
|
|
|
|
|
|
|
|
|
|
|
Property, plant and equipment expenditures(2) |
$ |
13.3 |
$ |
- |
$ |
0.1 |
$ |
13.4 |
$ |
(9.9) |
$ |
3.5 |
Intangible asset expenditures(2) |
|
- |
|
- |
|
0.1 |
|
0.1 |
|
- |
|
0.1 |
|
|
13.3 |
|
- |
|
0.2 |
|
13.5 |
$ |
(9.9) |
$ |
3.6 |
|
|
|
|
|
|
|
|
|
|
|
|
|
Adjustments: |
|
|
|
|
|
|
|
|
|
|
|
|
Accrual adjustment |
|
(0.1) |
|
- |
|
(0.1) |
|
(0.2) |
|
|
|
|
Spending on capital |
$ |
13.2 |
$ |
- |
$ |
0.1 |
$ |
13.3 |
|
|
|
|
|
|
|
|
|
|
|
|
|
|
|
|
|
$ millions, for the nine months ended September 30 |
|
|
|
|
|
|
|
|
|
2022 |
||
|
|
|
|
|
|
|
|
|
|
|
|
Total |
|
|
|
|
|
|
|
|
|
|
Adjustment |
|
derived from |
|
Moa JV and |
|
|
|
|
|
Combined |
|
for Moa |
|
financial |
|
|
Fort Site |
|
Power |
|
Other(1) |
|
total |
|
Joint Venture |
|
statements |
|
|
|
|
|
|
|
|
|
|
|
|
|
|
Property, plant and equipment expenditures(2) |
$ |
40.3 |
$ |
3.5 |
$ |
0.1 |
$ |
43.9 |
$ |
(25.9) |
$ |
18.0 |
Intangible asset expenditures(2) |
|
- |
|
- |
|
0.6 |
|
0.6 |
|
- |
|
0.6 |
|
|
40.3 |
|
3.5 |
|
0.7 |
|
44.5 |
$ |
(25.9) |
$ |
18.6 |
|
|
|
|
|
|
|
|
|
|
|
|
|
Adjustments: |
|
|
|
|
|
|
|
|
|
|
|
|
Accrual adjustment |
|
7.1 |
|
- |
|
- |
|
7.1 |
|
|
|
|
Spending on capital |
$ |
47.4 |
$ |
3.5 |
$ |
0.7 |
$ |
51.6 |
|
|
|
|
|
|
|
|
|
|
|
|
|
|
|
|
|
$ millions, for the nine months ended September 30 |
|
|
|
|
|
|
|
|
|
2021 |
||
|
|
|
|
|
|
|
|
|
|
|
|
Total |
|
|
|
|
|
|
|
|
|
|
Adjustment |
|
derived from |
|
Moa JV and |
|
|
|
|
|
Combined |
|
for Moa |
|
financial |
|
|
Fort Site |
|
Power |
|
Other(1) |
|
total |
|
Joint Venture |
|
statements |
|
|
|
|
|
|
|
|
|
|
|
|
|
|
Property, plant and equipment expenditures(2) |
$ |
25.7 |
$ |
- |
$ |
0.4 |
$ |
26.1 |
$ |
(18.9) |
$ |
7.2 |
Intangible asset expenditures(2) |
|
- |
|
- |
|
0.6 |
|
0.6 |
|
- |
|
0.6 |
|
|
25.7 |
|
- |
|
1.0 |
|
26.7 |
$ |
(18.9) |
$ |
7.8 |
|
|
|
|
|
|
|
|
|
|
|
|
|
Adjustments: |
|
|
|
|
|
|
|
|
|
|
|
|
Accrual adjustment |
|
(0.1) |
|
- |
|
(0.2) |
|
(0.3) |
|
|
|
|
Spending on capital |
$ |
25.6 |
$ |
- |
$ |
0.8 |
$ |
26.4 |
|
|
|
|
(1) |
Includes property, plant and equipment and intangible asset expenditures of the Oil and Gas and Corporate segments. |
|
(2) |
Total property, plant and equipment expenditures and total intangible asset expenditures as presented in the Corporation’s consolidated statements of cash flow. |
Combined free cash flow
The Corporation defines free cash flow for each segment as cash provided (used) by continuing operations for operating activities, less cash expenditures on property, plant and equipment and intangible assets, including exploration and evaluation assets. The Moa Joint Venture and Fort Site segment’s free cash flow includes the Fort Site’s free cash flow, plus the Corporation’s 50% share of the Moa Joint Venture’s free cash flow, which is accounted for using the equity method for accounting purposes. The Corporate segment’s cash used by continuing operations for operating activities is adjusted to exclude distributions received from Moa Joint Venture.
Combined free cash flow is the aggregate of each segment’s free cash flow or the Corporation’s consolidated cash provided (used) by continuing operations for operating activities, less consolidated cash expenditures on property, plant and equipment and intangible assets, including exploration and evaluation assets, less distributions received from Moa Joint Venture, plus cash provided (used) by continuing operations for operating activities for the Corporation’s 50% share of the Moa Joint Venture, less cash expenditures on property, plant and equipment and intangible assets for the Corporation’s 50% share of the Moa Joint Venture. Distributions from the Moa Joint Venture excluded from Corporate cash used by continuing operations for operating activities are included in the Adjustment for Moa Joint Venture to arrive at total cash provided (used) by continuing operations for operating activities per the financial statements.
Free cash flow is used by management, and management believes this information is used by investors, to analyze cash flows generated from operations and assess its operations’ ability to provide cash or its use of cash, after funding cash capital requirements, to service current and future working capital needs and service debt.
The tables below reconcile cash provided (used) by continuing operations for operating activities per the financial statements to combined free cash flow:
$ millions, for the three months ended September 30 |
|
|
|
|
|
|
|
|
|
|
|
|
|
2022 |
||||
|
|
|
|
|
|
|
|
|
|
|
|
|
|
|
|
|
|
|
|
|
|
|
|
|
|
|
|
|
|
|
|
|
|
|
|
|
Total |
|
|
|
|
|
|
|
|
|
|
|
|
|
|
|
Adjustment |
|
derived |
|
|
|
|
|
|
|
|
|
|
for Moa |
|
from |
|||||||
|
Moa JV and |
Metals |
Oil and |
|
Technol- |
|
Combined |
Joint |
|
financial |
||||||||
|
Fort Site(1) |
Other |
Gas |
Power |
ogies |
Corporate |
total |
Venture |
|
statements |
||||||||
|
|
|
|
|
|
|
|
|
|
|
|
|
|
|
|
|
|
|
Cash provided (used) by continuing operations for operating activities(2)
|
$ |
25.5 |
$ |
3.8 |
$ |
3.4 |
$ |
9.1 |
$ |
(3.6) |
$ |
(17.6) |
$ |
20.6 |
$ |
(1.8) |
$ |
18.8 |
Less: |
|
|
|
|
|
|
|
|
|
|
|
|
|
|
|
|
|
|
Property, plant and equipment expenditures |
|
(17.4) |
|
- |
|
(0.1) |
|
(3.0) |
|
- |
|
- |
|
(20.5) |
|
10.1 |
|
(10.4) |
Intangible expenditures |
|
- |
|
- |
|
- |
|
- |
|
- |
|
- |
|
- |
|
- |
|
- |
Free cash flow |
$ |
8.1 |
$ |
3.8 |
$ |
3.3 |
$ |
6.1 |
$ |
(3.6) |
$ |
(17.6) |
$ |
0.1 |
$ |
8.3 |
$ |
8.4 |
$ millions, for the three months ended September 30 |
|
|
|
|
|
|
|
|
|
|
|
|
|
2021 |
||||
|
|
|
|
|
|
|
|
|
|
|
|
|
|
|
|
|
|
|
|
|
|
|
|
|
|
|
|
|
|
|
|
|
|
|
|
|
Total |
|
|
|
|
|
|
|
|
|
|
|
|
|
|
|
Adjustment |
|
derived |
|
|
|
|
|
|
|
|
|
|
for Moa |
|
from |
|||||||
|
Moa JV and |
Metals |
Oil and |
|
Technol- |
|
Combined |
Joint |
|
financial |
||||||||
|
Fort Site(1) |
Other |
Gas |
Power |
ogies |
Corporate |
total |
Venture |
|
statements |
||||||||
|
|
|
|
|
|
|
|
|
|
|
|
|
|
|
|
|
|
|
Cash provided (used) by continuing operations for operating activities(2)
|
$ |
36.5 |
$ |
(2.3) |
$ |
2.1 |
$ |
3.0 |
$ |
(2.9) |
$ |
(3.6) |
$ |
32.8 |
$ |
(16.6) |
$ |
16.2 |
Less: |
|
|
|
|
|
|
|
|
|
|
|
|
|
|
|
|
|
|
Property, plant and equipment expenditures |
|
(13.3) |
|
- |
|
- |
|
- |
|
- |
|
(0.1) |
|
(13.4) |
|
9.9 |
|
(3.5) |
Intangible expenditures |
|
- |
|
- |
|
(0.1) |
|
- |
|
- |
|
- |
|
(0.1) |
|
- |
|
(0.1) |
Free cash flow |
$ |
23.2 |
$ |
(2.3) |
$ |
2.0 |
$ |
3.0 |
$ |
(2.9) |
$ |
(3.7) |
$ |
19.3 |
$ |
(6.7) |
$ |
12.6 |
$ millions, for the nine months ended September 30 |
|
|
|
|
|
|
|
|
|
|
|
|
|
2022 |
||||
|
|
|
|
|
|
|
|
|
|
|
|
|
|
|
|
|
|
|
|
|
|
|
|
|
|
|
|
|
|
|
|
|
|
|
|
|
Total |
|
|
|
|
|
|
|
|
|
Adjustment |
|
derived |
|||||||
|
|
|
|
|
|
|
|
|
|
|
|
|
|
|
|
for Moa |
|
from |
|
Moa JV and |
Metals |
Oil and |
|
Technol- |
|
Combined |
Joint |
|
financial |
||||||||
|
Fort Site(3) |
Other |
Gas |
Power |
ogies |
Corporate |
total |
Venture |
|
statements |
||||||||
|
|
|
|
|
|
|
|
|
|
|
|
|
|
|
|
|
|
|
Cash provided (used) by continuing operations for operating activities(4)
|
$ |
91.4 |
$ |
(1.4) |
$ |
(2.2) |
$ |
23.9 |
$ |
(10.6) |
$ |
(34.7) |
$ |
66.4 |
$ |
(16.4) |
$ |
50.0 |
Less: |
|
|
|
|
|
|
|
|
|
|
|
|
|
|
|
|
|
|
Property, plant and equipment expenditures |
|
(40.3) |
|
- |
|
(0.1) |
|
(3.5) |
|
- |
|
- |
|
(43.9) |
|
25.9 |
|
(18.0) |
Intangible expenditures |
|
- |
|
- |
|
(0.6) |
|
- |
|
- |
|
- |
|
(0.6) |
|
- |
|
(0.6) |
Free cash flow |
$ |
51.1 |
$ |
(1.4) |
$ |
(2.9) |
$ |
20.4 |
$ |
(10.6) |
$ |
(34.7) |
$ |
21.9 |
$ |
9.5 |
$ |
31.4 |
$ millions, for the nine months ended September 30 |
|
|
|
|
|
|
|
|
|
|
|
|
|
2021 |
||||
|
|
|
|
|
|
|
|
|
|
|
|
|
|
|
|
|
|
|
|
|
|
|
|
|
|
|
|
|
|
|
|
|
|
|
|
|
Total |
|
|
|
|
|
|
|
|
|
Adjustment |
|
derived |
|||||||
|
|
|
|
|
|
|
|
|
|
|
|
|
for Moa |
|
from |
|||
|
Moa JV and |
Metals |
Oil and |
|
|
Technol- |
|
|
Combined |
|
Joint |
|
financial |
|||||
|
Fort Site(3) |
Other |
Gas |
Power |
ogies |
|
Corporate |
total |
Venture |
|
statements |
|||||||
|
|
|
|
|
|
|
|
|
|
|
|
|
|
|
|
|
|
|
Cash provided (used) by continuing operations for operating activities(4)
|
$ |
81.6 |
$ |
8.2 |
$ |
1.9 |
$ |
17.3 |
$ |
(8.8) |
$ |
(32.6) |
$ |
67.6 |
$ |
(52.9) |
$ |
14.7 |
Less: |
|
|
|
|
|
|
|
|
|
|
|
|
|
|
|
|
|
|
Property, plant and equipment expenditures |
|
(25.7) |
|
- |
|
(0.2) |
|
- |
|
- |
|
(0.2) |
|
(26.1) |
|
18.9 |
|
(7.2) |
Intangible expenditures |
|
- |
|
- |
|
(0.6) |
|
- |
|
- |
|
- |
|
(0.6) |
|
- |
|
(0.6) |
Free cash flow |
$ |
55.9 |
$ |
8.2 |
$ |
1.1 |
$ |
17.3 |
$ |
(8.8) |
$ |
(32.8) |
$ |
40.9 |
$ |
(34.0) |
$ |
6.9 |
(1) |
|
Property, plant and equipment expenditures and intangible expenditures for the Moa Joint Venture and Fort Site was $10.1 million and $7.3 million, respectively, for the three months ended September 30, 2022 (September 30, 2021 - $9.9 million and $3.4 million, respectively). |
(2) |
|
Cash provided (used) by continuing operations for operating activities for the Moa Joint Venture and Fort Site was $2.0 million and $23.5 million, respectively, for the three months ended September 30, 2022 (September 30, 2021 - $29.3 million and $7.2 million, respectively). |
(3) |
|
Property, plant and equipment expenditures and intangible expenditures for the Moa Joint Venture and Fort Site was $25.9 million and $14.4 million, respectively, for the nine months ended September 30, 2022 (September 30, 2021 - $18.9 million and $6.8 million, respectively). |
(4) |
|
Cash provided (used) by continuing operations for operating activities for the Moa Joint Venture and Fort Site was $60.0 million and $31.4 million, respectively, for the nine months ended September 30, 2022 (September 30, 2021 - $88.8 million and $(7.2) million, respectively). |
View source version on businesswire.com: https://www.businesswire.com/news/home/20221102005834/en/
