FinVolution Group Reports First Quarter 2024 Unaudited Financial Results
-First Quarter China Transaction Volume reached RMB46.1 billion, up 10.3% year-over-year-
-First Quarter International Transaction Volume reached RMB2.21 billion, up 40.8% year-over-year-
-First Quarter International Revenues increased to RMB594.8 million, up 32.9% year-over-year and contributing 18.8% of total net revenues-
SHANGHAI, May 15, 2024 /PRNewswire/ -- FinVolution Group ("FinVolution" or the "Company") (NYSE: FINV), a leading fintech platform, today announced its unaudited financial results for the first quarter ended March 31, 2024.
                                                                             For
              the
                                                                           Three Months Ended/As of             YoY

                                                                                                              Change


                                                                  March                             March
                                                                  31, 2023                          31, 2024


              Total Transaction Volume (RMB in billions)[1]        43.4                               48.3       11.3 %


     Transaction Volume (China's Mainland)[2]                        41.8                               46.1       10.3 %


     Transaction Volume (International)[3]                           1.57                               2.21       40.8 %


              Total Outstanding Loan Balance (RMB in billions)     62.3                               65.3        4.8 %


     Outstanding Loan Balance (China's Mainland)[4]                  61.3                               64.0        4.4 %


     Outstanding Loan Balance (International)[5]                     0.95                               1.27       33.7 %
First Quarter 2024 China Market Operational Highlights
    --  Cumulative registered users([6]) reached 158.7 million as of March 31,
        2024, an increase of 8.3% compared with March 31, 2023.
    --  Cumulative borrowers([7]) reached 25.5 million as of March 31, 2024, an
        increase of 6.3% compared with March 31, 2023.
    --  Number of unique borrowers([8]) for the first quarter of 2024 was 1.8
        million, a decrease of 18.2% compared with the same period of 2023.
    --  Transaction volume([2]) reached RMB46.1 billion for the first quarter of
        2024, an increase of 10.3% compared with the same period of 2023.
    --  Transaction volume facilitated for repeat individual borrowers([9]) for
        the first quarter of 2024 was RMB39.3 billion, an increase of 5.9%
        compared with the same period of 2023.
    --  Outstanding loan balance([4]) reached RMB64.0 billion as of March 31,
        2024, an increase of 4.4% compared with March 31, 2023.
    --  Average loan size([10] )was RMB10,121 for the first quarter of 2024,
        compared with RMB7,908 for the same period of 2023.
    --  Average loan tenure([11] )was 8.2 months for the first quarter of 2024,
        compared with 8.5 months for the same period of 2023.
    --  90 day+ delinquency ratio([12]) was 2.45% as of March 31, 2024, compared
        with 1.72% as of March 31, 2023.
First Quarter 2024 International Market Operational Highlights
    --  Cumulative registered users([13]) reached 26.8 million as of March 31,
        2024, an increase of 49.7% compared with March 31, 2023.
    --  Cumulative borrowers([14]) for the international market reached 5.1
        million as of March 31, 2024, an increase of 37.8% compared with March
        31, 2023.
    --  Number of unique borrowers([15]) for the first quarter of 2024 was 0.85
        million, an increase of 14.9% compared with the same period of 2023.
    --  Number of new borrowers([16]) for the first quarter of 2024 was 0.34
        million, an increase of 9.7% compared with the same period of 2023.
    --  Transaction volume([3]) reached RMB2.21 billion for the first quarter of
        2024, an increase of 40.8% compared with the same period of 2023.
    --  Outstanding loan balance([5]) reached RMB1.27 billion as of March 31,
        2024, an increase of 33.7% compared with March 31, 2023.
    --  International business revenue was RMB594.8 million (US$82.4 million)
        for the first quarter of 2024, an increase of 32.9% compared with the
        same period of 2023, representing 18.8% of total revenue for the first
        quarter of 2024.
First Quarter 2024 Financial Highlights
    --  Net revenue was RMB3,165.1 million (US$438.4 million) for the first
        quarter of 2024, compared with RMB3,050.6 million for the same period of
        2023.
    --  Net profit was RMB532.0 million (US$73.7 million) for the first quarter
        of 2024, compared with RMB689.8 million for the same period of 2023.
    --  Non-GAAP adjusted operating income,([17]) which excludes share-based
        compensation expenses before tax, was RMB658.7 million (US$91.2 million)
        for the first quarter of 2024, compared with RMB762.6 million for the
        same period of 2023.
    --  Diluted net profit per American depositary share ("ADS") was RMB1.97
        (US$0.27) and diluted net profit per share was RMB0.39 (US$0.05) for the
        first quarter of 2024, compared with RMB2.42 and RMB0.48 for the same
        period of 2023 respectively.
    --  Non-GAAP diluted net profit per ADS was RMB2.08 (US$0.29) and non-GAAP
        diluted net profit per share was RMB0.42 (US$0.06) for the first quarter
        of 2024, compared with RMB2.49 and RMB0.50 for the same period of 2023
        respectively. Each ADS of the Company represents five Class A ordinary
        shares of the Company.
     [1]
               Represents the total transaction volume facilitated in China's Mainland and the international markets on the Company's platforms during the period presented.


     [2]
               Represents our transaction volume facilitated in China's Mainland during the period presented.


     [3]
               Represents our transaction volume facilitated in markets outside China's Mainland during the period presented.


     [4]
               Outstanding loan balance (China's Mainland) as of any date refers to the balance of outstanding loans in China's Mainland market excluding loans delinquent for more than 180 days from such date.


     [5]
              Outstanding loan balance (international) as of any date refers to the balance of outstanding loans in the international markets excluding loans delinquent for more than 30 days from such date.


     [6]
              On a cumulative basis, the total number of users in China's Mainland market registered on the Company's platform as of March 31, 2024.


     [7]
              On a cumulative basis, the total number of borrowers in China's Mainland market registered on the Company's platform as of March 31, 2024.


     [8]
              Represents the total number of borrowers in China's Mainland who have successfully borrowed on the Company's platform during the period presented.


     [9]
              Represents the transaction volume facilitated for repeat borrowers in China's Mainland who successfully completed a transaction on the Company's platform during the period presented.


     [10]
              Represents the average loan size on the Company's platform in China's Mainland during the period presented.


     [11]
              Represents the average loan tenor on the Company's platform in China's Mainland during the period presented.


        [12]
               "90 day+ delinquency ratio" refers to the outstanding principal balance of on-and-off balance sheet loans that were 90 to 179 calendar days past due as a percentage of the total outstanding principal balance of on-and-off balance sheet loans on the Company's platform as of a specific date.
         Loans that originated outside China's Mainland are not included in the calculation.


     [13]
              On a cumulative basis, the total number of users registered on the Company's platforms outside China's Mainland market as of March 31, 2024.


     [14]
              On a cumulative basis, the total number of borrowers on the Company's platforms outside China's Mainland market, as of March 31, 2024.


     [15]
              Represents the total number of borrowers outside China's Mainland who have successfully borrowed on the Company platforms during the period presented.


     [16]
              Represents the total number of new borrowers outside China's Mainland whose transactions were facilitated on the Company's platforms during the period presented.


     [17]
              Please refer to "UNAUDITED Reconciliation of GAAP And Non-GAAP Results" for reconciliation between GAAP and Non-GAAP adjusted operating income.
Mr. Tiezheng Li, Chief Executive Officer of FinVolution, commented, "In line with our Local Focus, Global Outlook strategy, we had cumulatively served 30.7 million borrowers across China, Indonesia and the Philippines as of the end of the first quarter of 2024. Our first quarter performance highlights our strategy's effectiveness as well as its flexibility. Transaction volume in the China market reached RMB46.1 billion, up 10.3% year-over-year, while outstanding loan balance increased to RMB64.0 billion, up 4.4% year-over-year.
"Our international markets continued to deliver solid growth with transaction volume reaching RMB2.21 billion, up 40.8% year-over-year, while outstanding loan balance further expanded to RMB1.27 billion, up 33.7% year-over-year, demonstrating our ability to capture opportunities in various countries," concluded Mr. Li.
Mr. Jiayuan Xu, FinVolution's Chief Financial Officer, continued, "Our financial performance improved progressively with net revenues for the quarter reaching RMB3,165.1 million (US$438.4 million), up 3.8% year-over-year. Notably, contributions from international revenue grew to RMB594.8 million (US$82.4 million), up 32.9% year-over-year, and representing 18.8% of total revenue. Our total liquidity position as of March 31, 2024 stood at RMB8,535.3 million (US$1,182.1 million), up 10.1% year-over-year.
"As part of our commitment to consistently return value to shareholders, we deployed US$27.2 million in the first quarter of 2024 to repurchase our shares on the secondary market. Cumulatively, we have returned a total of US$632.2 million to our shareholders through our capital return program since 2018, demonstrating our consistent and sustainable commitment to our shareholders," concluded Mr. Xu.
First Quarter 2024 Financial Results
Net revenue for the first quarter of 2024 was RMB3,165.1 million (US$438.4 million), compared with RMB3,050.6 million for the same period of 2023. This increase was primarily due to the increase in guarantee income and other revenue.
Loan facilitation service fees was RMB985.9 million (US$136.6 million) for the first quarter of 2024, compared with RMB1,168.3 million for the same period of 2023. This decrease was primarily due to the decrease in service fee rates, partially offset by the increase in transaction volume.
Post-facilitation service fees was RMB465.2 million (US$64.4 million) for the first quarter of 2024, compared with RMB487.2 million for the same period of 2023. This decrease was primarily due to the decrease in service fee rates and the rolling impact of deferred transaction fees.
Guarantee income was RMB1,346.1 million (US$186.4 million) for the first quarter of 2024, compared with RMB986.5 million for the same period of 2023. This increase was primarily due to the increased outstanding loan balance of off-balance sheet loans, higher guarantee rates and the rolling impact of deferred guarantee income. The fair value of quality assurance commitment upon loan origination is released as guarantee income systematically over the term of the loans subject to quality assurance commitment.
Net interest income was RMB231.3 million (US$32.0 million) for the first quarter of 2024, compared with RMB285.6 million for the same period of 2023. This decrease was primarily due to the decrease in the average outstanding loan balances of on-balance sheet loans.
Other revenue was RMB136.5 million (US$18.9 million) for the first quarter of 2024, compared with RMB123.1 million for the same period of 2023. This increase was primarily due to the increase in customer referral fees from financial institutions.
Origination, servicing expenses and other costs of revenue was RMB539.6 million (US$74.7 million) for the first quarter of 2024, compared with RMB512.4 million for the same period of 2023. This increase was primarily due to the increase in facilitation costs and loan collection expenses as a result of higher transaction volume.
Sales and marketing expenses was RMB449.2 million (US$62.2 million) for the first quarter of 2024, compared with RMB397.1 million for the same period of 2023, as a result of our more proactive customer acquisition efforts focusing on better quality borrowers in both China and the international markets.
Research and development expenses was RMB120.5 million (US$16.7 million) for the first quarter of 2024, compared with RMB126.2 million for the same period of 2023. This decrease was primarily due to the increase in technology development efficiency.
General and administrative expenses was RMB82.3 million (US$11.4 million) for the first quarter of 2024, compared with RMB85.4 million for the same period of 2023. This decrease was primarily due to the increase in operating efficiency and rent savings.
Provision for accounts receivable and contract assets was RMB65.7 million (US$9.1 million) for the first quarter of 2024, compared with RMB63.2 million for the same period of 2023. This increase was primarily due to the increase in loan volume and outstanding loan balances of off-balance sheet loans.
Provision for loans receivable was RMB81.3 million (US$11.3 million) for the first quarter of 2024, compared with RMB143.3 million for the same period of 2023. This decrease was primarily due to the decrease in the loan volume and the outstanding loan balances of on-balance sheet loans in the international markets.
Credit losses for quality assurance commitment was RMB1,198.1 million (US$165.9 million) for the first quarter of 2024, compared with RMB980.7 million for the same period of 2023. The increase was primarily due to the increases in delinquency rates, loan volume and outstanding loan balance in the international markets.
Operating profit was RMB628.4 million (US$87.0 million) for the first quarter of 2024, compared with RMB742.3 million for the same period of 2023.
Non-GAAP adjusted operating income, which excludes share-based compensation expenses before tax, was RMB658.7 million (US$91.2 million) for the first quarter of 2024, compared with RMB762.6 million for the same period of 2023.
Other income was RMB31.0 million (US$4.3 million) for the first quarter of 2024, compared with RMB82.8 million for the same period of 2023. This decrease was mainly due to the decrease in exchange gains.
Income tax expense was RMB127.5 million (US$17.7 million) for the first quarter of 2024, compared with RMB135.2 million for the same period of 2023. This decrease was mainly due to the decrease in pre-tax profit and the change in effective tax rate.
Net profit was RMB532.0 million (US$73.7 million) for the first quarter of 2024, compared with RMB689.8 million for the same period of 2023.
Net profit attributable to ordinary shareholders of the Company was RMB527.7 million (US$73.1 million) for the first quarter of 2024, compared with RMB695.9 million for the same period of 2023.
Diluted net profit per ADS was RMB1.97 (US$0.27) and diluted net profit per share was RMB0.39 (US$0.05) for the first quarter of 2024, compared with RMB2.42 and RMB0.48 for the same period of 2023 respectively.
Non-GAAP diluted net profit per ADS was RMB2.08 (US$0.29) and non-GAAP diluted net profit per share was RMB0.42 (US$0.06) for the first quarter of 2024, compared with RMB2.49 and RMB0.50 for the same period of 2023 respectively. Each ADS represents five Class A ordinary shares of the Company.
As of March 31, 2024, the Company had cash and cash equivalents of RMB6,211.5 million (US$860.3 million) and short-term investments, mainly in wealth management products and term deposit, of RMB2,323.8 million (US$321.8 million).
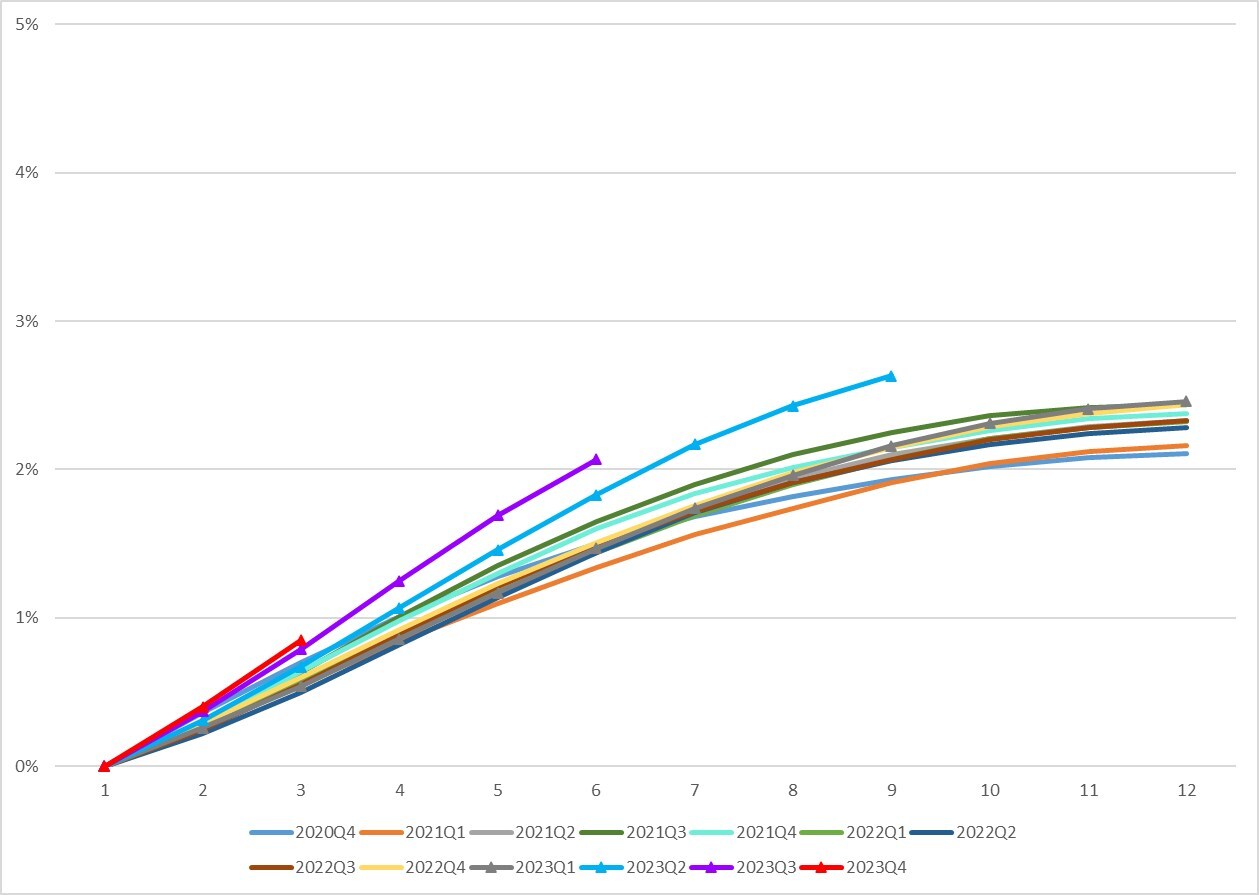
The following chart shows the historical cumulative 30-day plus past due delinquency rates by loan origination vintage for loan products facilitated through the Company's platform in China's Mainland as of March 31, 2024:
Click here to view the chart
Shares Repurchase Update
For the first quarter of 2024, the Company deployed a total of US$27.2 million to repurchase its own Class A ordinary shares in the form of ADSs in the market. As of March 31, 2024, in combination with the Company's historical and existing share repurchase programs, the Company had cumulatively repurchased its own Class A ordinary shares in the form of ADSs with a total aggregate value of approximately US$307.2 million since 2018.
Business Outlook
While the macroeconomic recovery continued to gain traction with pockets of improvement since the beginning of 2024, uncertainties persist in the markets in which we operate. The Company has observed encouraging signs of recovery and will continue to closely monitor macro conditions across our pan-Asian markets and remain prudent in our business operations. The Company reiterates its full year 2024 transaction volume guidance for the China market in the range of RMB195.7 billion to RMB205.0 billion, representing year-over-year growth of approximately 5.0% to 10.0%. At the same time, the Company expects its full year 2024 transaction volume for the international markets to be in the range of RMB9.4 billion to RMB11.0 billion, representing year-over-year growth of approximately 20.0% to 40.0%.
The above forecast is based on the current market conditions and reflects the Company's current preliminary views and expectations on market and operational conditions and the regulatory and operating environment, as well as customers' and institutional partners' demands, all of which are subject to change.
Conference Call
The Company's management will host an earnings conference call at 8:30 PM U.S. Eastern Time on May 15, 2024 (8:30 AM Beijing/Hong Kong Time on May 16, 2024).
Dial-in details for the earnings conference call are as follows:
     United States (toll free):    +1-888-346-8982


     Canada (toll free):           +1-855-669-9657


     International:                +1-412-902-4272


     Hong Kong, China (toll free): 800-905-945


     Hong Kong, China:             +852-3018-4992


     Mainland, China:              400-120-1203
Participants should dial in at least five minutes before the scheduled start time and ask to be connected to the call for "FinVolution Group."
Additionally, a live and archived webcast of the conference call will be available on the Company's investor relations website at https://ir.finvgroup.com.
A replay of the conference call will be accessible approximately one hour after the conclusion of the live call until May 22, 2024, by dialing the following telephone numbers:
     United States (toll free): +1-877-344-7529


     Canada (toll free):        +1-855-669-9658


     International:             +1-412-317-0088


     Replay Access Code:                3495737
About FinVolution Group
FinVolution Group is a leading fintech platform with strong brand recognition in China and the international markets connecting borrowers of the young generation with financial institutions. Established in 2007, the Company is a pioneer in China's online consumer finance industry and has developed innovative technologies and has accumulated in-depth experience in the core areas of credit risk assessment, fraud detection, big data and artificial intelligence. The Company's platforms, empowered by proprietary cutting-edge technologies, features a highly automated loan transaction process, which enables a superior user experience. As of March 31, 2024, the Company had over 185.5 million cumulative registered users across China, Indonesia and the Philippines.
For more information, please visit https://ir.finvgroup.com
Use of Non-GAAP Financial Measures
We use non-GAAP adjusted operating income, non-GAAP operating margin, non-GAAP net profit, non-GAAP net profit attributable to FinVolution Group, and non-GAAP basic and diluted net profit per share and per ADS which are non-GAAP financial measures, in evaluating our operating results and for financial and operational decision-making purposes. We believe that these non-GAAP financial measures help identify underlying trends in our business by excluding the impact of share-based compensation expenses and expected discretionary measures. We believe that non-GAAP financial measures provide useful information about our operating results, enhance the overall understanding of our past performance and future prospects and allow for greater visibility with respect to key metrics used by our management in its financial and operational decision-making.
Non-GAAP adjusted operating income, non-GAAP operating margin, non-GAAP net profit, non-GAAP net profit attributable to FinVolution Group, and non-GAAP basic and diluted net profit per share and per ADS are not defined under U.S. GAAP and are not presented in accordance with U.S. GAAP. These non-GAAP financial measures have limitations as analytical tool, and when assessing our operating performance, cash flows or our liquidity, investors should not consider it in isolation, or as a substitute for net income, cash flows provided by operating activities or other consolidated statements of operation and cash flow data prepared in accordance with U.S. GAAP. The Company encourages investors and others to review our financial information in its entirety and not rely on a single financial measure.
For more information on this non-GAAP financial measure, please see the table captioned "Reconciliations of GAAP and Non-GAAP results" set forth at the end of this press release.
Exchange Rate Information
This announcement contains translations of certain RMB amounts into U.S. dollars at a specified rate solely for the convenience of the reader. Unless otherwise noted, all translations from RMB to U.S. dollars are made at a rate of RMB7.2203 to US$1.00, the rate in effect as of March 29, 2024 as certified for customs purposes by the Federal Reserve Bank of New York.
Safe Harbor Statement
This press release contains forward-looking statements. These statements constitute "forward-looking" statements within the meaning of Section 21E of the Securities Exchange Act of 1934, as amended, and as defined in the U.S. Private Securities Litigation Reform Act of 1995. These forward-looking statements can be identified by terminology such as "will," "expects," "anticipates," "future," "intends," "plans," "believes," "estimates," "target," "confident" and similar statements. Such statements are based upon management's current expectations and current market and operating conditions and relate to events that involve known or unknown risks, uncertainties and other factors, all of which are difficult to predict and many of which are beyond the Company's control. Forward-looking statements involve risks, uncertainties and other factors that could cause actual results to differ materially from those contained in any such statements. Potential risks and uncertainties include, but are not limited to, uncertainties as to the Company's ability to attract and retain borrowers and investors on its marketplace, its ability to increase volume of loans facilitated through the Company's marketplace, its ability to introduce new loan products and platform enhancements, its ability to compete effectively, laws, regulations and governmental policies relating to the online consumer finance industry in China, general economic conditions in China, and the Company's ability to meet the standards necessary to maintain listing of its ADSs on the NYSE, including its ability to cure any non-compliance with the NYSE's continued listing criteria. Further information regarding these and other risks, uncertainties or factors is included in the Company's filings with the U.S. Securities and Exchange Commission. All information provided in this press release is as of the date of this press release, and FinVolution does not undertake any obligation to update any forward-looking statement as a result of new information, future events or otherwise, except as required under applicable law.
For investor and media inquiries, please contact:
In China:
FinVolution Group
Head of Investor Relations
Jimmy Tan, IRC
Tel: +86 (21) 8030-3200 Ext. 8601
E-mail: ir@xinye.com
Piacente Financial Communications
Jenny Cai
Tel: +86 (10) 6508-0677
E-mail: finv@tpg-ir.com
In the United States:
Piacente Financial Communications
Brandi Piacente
Tel: +1-212-481-2050
E-mail: finv@tpg-ir.com
FinVolution Group
UNAUDITED INTERIM CONDENSED CONSOLIDATED BALANCE SHEETS
(All amounts in thousands, except share data, or otherwise noted)
As of December
31, As of March 31,
2023 2024
RMB RMB USD
Assets
Cash and cash equivalents 4,969,319 6,211,480 860,280
Restricted cash 1,800,071 1,378,568 190,929
Short-term investments 2,960,821 2,323,835 321,847
Investments 1,135,133 1,150,379 159,326
Quality assurance receivable, net of credit loss allowance for 1,755,615 1,794,789 248,575
quality assurance receivable of RMB529,392 and
RMB545,725 as of December 31, 2023 and March 31, 2024,
respectively
Intangible assets 98,692 98,692 13,669
Property, equipment and software, net 140,933 613,883 85,022
Loans receivable, net of credit loss allowance for loans receivable 1,127,388 954,064 132,136
of RMB214,550 and RMB204,264 as of December 31, 2023 and
March 31
, 2024, respectively
Accounts receivable and contract assets, net of credit loss 2,208,538 2,128,610 294,809
allowance for accounts receivable and contract assets of
RMB310,394 and RMB289,346 as of December 31, 2023 and
March 31
, 2024, respectively
Deferred tax assets 1,624,325 1,824,847 252,738
Right of use assets 38,110 32,082 4,443
Prepaid expenses and other assets 3,384,317 2,837,919 393,047
Goodwill 50,411 50,411 6,982
Total assets 21,293,673 21,399,559 2,963,803
Liabilities and Shareholders' Equity
Deferred guarantee income 1,882,036 1,826,629 252,985
Liability from quality assurance commitment 3,306,132 3,088,269 427,720
Payroll and welfare payable 261,528 165,193 22,879
Taxes payable 207,477 364,000 50,413
Short-term borrowings 5,756 5,688 788
Funds payable to investors of consolidated trusts 436,352 332,598 46,064
Contract liability 5,109 5,109 708
Deferred tax liabilities 340,608 333,264 46,157
Accrued expenses and other liabilities 941,899 984,411 136,339
Leasing liabilities 35,878 33,152 4,591
Dividends payable 441,331 61,124
Total liabilities 7,422,775 7,579,644 1,049,768
Commitments and contingencies
FinVolution Group Shareholders' equity
Ordinary shares 103 103 14
Additional paid-in capital 5,748,734 5,776,852 800,085
Treasury stock (1,199,683) (1,391,529) (192,725)
Statutory reserves 762,472 762,472 105,601
Accumulated other comprehensive income 80,006 91,138 12,622
Retained Earnings 8,357,153 8,443,523 1,169,414
Total FinVolution Group shareholders' equity 13,748,785 13,682,559 1,895,011
Non-controlling interest 122,113 137,356 19,024
Total shareholders' equity 13,870,898 13,819,915 1,914,035
Total liabilities and shareholders' equity 21,293,673 21,399,559 2,963,803
FinVolution Group
UNAUDITED INTERIM CONDENSED CONSOLIDATED STATEMENTS OF COMPREHENSIVE
INCOME
(All amounts in thousands, except share data, or otherwise noted)
For the Three Months Ended March 31,
2023 2024
RMB RMB USD
Operating revenue:
Loan facilitation service fees 1,168,253 985,940 136,551
Post-facilitation service fees 487,171 465,192 64,428
Guarantee income 986,520 1,346,115 186,435
Net interest income 285,632 231,307 32,036
Other Revenue 123,067 136,527 18,909
Net revenue 3,050,643 3,165,081 438,359
Operating expenses:
Origination, servicing expenses and other cost of revenue (512,428) (539,555) (74,728)
Sales and marketing expenses (397,118) (449,209) (62,215)
Research and development expenses (126,216) (120,495) (16,688)
General and administrative expenses (85,402) (82,327) (11,402)
Provision for accounts receivable
and contract assets (63,200) (65,662) (9,094)
Provision for loans receivable (143,316) (81,285) (11,258)
Credit losses for quality assurance commitment (980,683) (1,198,099) (165,935)
Total operating expenses (2,308,363) (2,536,632) (351,320)
Operating profit 742,280 628,449 87,039
Other income, net 82,777 31,004 4,294
Profit before income tax expense 825,057 659,453 91,333
Income tax expenses (135,237) (127,477) (17,655)
Net profit 689,820 531,976 73,678
Net profit attributable to non-controlling interest shareholders (6,064) 4,275 592
Net profit attributable to FinVolution Group 695,884 527,701 73,086
Foreign currency translation adjustment, net of nil tax (29,168) 11,132 1,542
Total comprehensive income attributable to FinVolution Group 666,716 538,833 74,628
Weighted average number of ordinary shares used in computing net income per share
Basic 1,410,573,744 1,311,510,218 1,311,510,218
Diluted 1,436,889,563 1,341,193,159 1,341,193,159
Net profit per share attributable to FinVolution
Group's ordinary shareholders
Basic 0.49 0.40 0.06
Diluted 0.48 0.39 0.05
Net profit per ADS attributable to FinVolution Group's ordinary shareholders (one ADS equal five ordinary shares)
Basic 2.47 2.01 0.28
Diluted 2.42 1.97 0.27
                FinVolution Group


               UNAUDITED INTERIM CONDENSED CONSOLIDATED STATEMENTS OF CASH FLOWS


                (All amounts in thousands, except share data, or otherwise noted)


                                                                                                                                                                    Three Months Ended March 31,


                                                                                                                                                               2023                                2024


                                                                                                                                                                RMB                 RMB               USD


     Net cash provided by/(used in) operating activities                                                                                                   672,286              194,465             26,933


     Net cash provided by
              /(used in)
              investing activities                                                                           1,805,886              925,545            128,187


     Net cash
              provided by
              /(
              used in)
             financing activities                                                      (886,716)           (291,148)          (40,324)


     Effect of exchange rate changes on cash and cash equivalents                                                                                         (26,403)             (8,204)           (1,137)


     Net increase/(decrease) in cash, cash equivalent and restricted cash                                                                                1,565,053              820,658            113,659


     Cash, cash equivalent and restricted cash at beginning of period                                                                                    6,479,087            6,769,390            937,550


     Cash, cash equivalent and restricted cash at end of period                                                                                          8,044,140            7,590,048          1,051,209
                FinVolution Group


                UNAUDITED Reconciliation of GAAP and Non-GAAP Results


                 (All amounts in thousands, except share data, or otherwise noted)


                                                                                                                                                                                                           For the Three Months Ended March 31,


                                                                                                                                                                                                      2023                                           2024


                                                                                                                                                                                                       RMB              RMB                             USD


                Net Revenues                                                                                                                                                                  3,050,643         3,165,081                          438,359


     Less: total operating expenses                                                                                                                                                           (2,308,363)      (2,536,632)                       (351,320)


                Operating Income                                                                                                                                                                742,280           628,449                           87,039


     Add: share-based compensation expenses                                                                                                                                                        20,359            30,289                            4,195


                Non-GAAP adjusted operating income                                                                                                                                              762,639           658,738                           91,234


                Operating Margin                                                                                                                                                                 25.0 %           19.9 %                          19.9 %


                Non-GAAP operating margin                                                                                                                                                        25.6 %           20.8 %                          20.8 %


                Non-GAAP adjusted operating income                                                                                                                                              762,639           658,738                           91,234


     Add: other income, net                                                                                                                                                                        82,777            31,004                            4,294


     Less: income tax expenses                                                                                                                                                                  (135,237)        (127,477)                        (17,655)


                Non-GAAP net profit                                                                                                                                                             710,179           562,265                           77,873


     Net profit attributable to non-controlling interest
              shareholders                                                                                                                  (6,064)            4,275                              592


                Non-GAAP net profit attributable to FinVolution Group                                                                                                                           716,243           557,990                           77,281


                Weighted average number of ordinary shares used in computing net income per share


     Basic                                                                                                                                                                                  1,410,573,744     1,311,510,218                    1,311,510,218


     Diluted                                                                                                                                                                                1,436,889,563     1,341,193,159                    1,341,193,159


                Non-GAAP net profit per share attributable to FinVolution Group's ordinary shareholders


     Basic                                                                                                                                                                                           0.51              0.43                             0.06


     Diluted                                                                                                                                                                                         0.50              0.42                             0.06


                Non-GAAP net profit per ADS attributable to FinVolution Group's ordinary shareholders (one ADS equal five


                ordinary shares)


     Basic                                                                                                                                                                                           2.54              2.13                             0.29


     Diluted                                                                                                                                                                                         2.49              2.08                             0.29
View original content:https://www.prnewswire.com/news-releases/finvolution-group-reports-first-quarter-2024-unaudited-financial-results-302146490.html
SOURCE FinVolution Group
