FinVolution Group Reports Fourth Quarter and Fiscal Year 2023 Unaudited Financial Results
-2023 Full Year Total Transaction Volume reached new record high of RMB194.3 billion, up 10.8% compared to Fiscal Year 2022-
-2023 Full Year Net Revenues reached new record high to RMB12.5 billion, up 12.7% compared to Fiscal Year 2022-
-2023 Full Year International Transaction Volume increased to RMB7.85 billion, up 84.7% compared to Fiscal Year 2022-
-2023 Full Year International Revenues increased to RMB2.1 billion, up 85.9% compared to Fiscal Year 2022 and contributing 17.0% of total net revenues-
SHANGHAI, March 18, 2024 /PRNewswire/ -- FinVolution Group ("FinVolution" or the "Company") (NYSE: FINV), a leading fintech platform, today announced its unaudited financial results for the fourth quarter and fiscal year ended December 31, 2023.
                                                                  For
              the             YoY                     For
                                                                   Three Months Ended/As of                                  Full
                                                                                                                       Year                  YoY
                                                         December 31,
                                                                                            Change                    Ended                Change
                                                                                                     D
              e

                                                                                                           cember 31,


                                                         2022               2023                      2022       2023


              Total Transaction Volume (RMB in 48.6               52.4              7.8 %  175.4      194.3                10.8 %
    billion)[1]


            Transaction Volume (China's                 47.2               50.1              6.1 %  171.1      186.4
    Mainland)[2]
                                                                                                                                  8.9 %


            Transaction Volume (International)[3]       1.37               2.25             64.2 %   4.25       7.85                84.7 %


              Total Outstanding Loan Balance   64.6               67.4              4.3 %   64.6       67.4                 4.3 %
    (RMB in billion)


            Outstanding Loan Balance (China's           63.8               66.1              3.6 %   63.8       66.1                 3.6 %
    Mainland)[4]


            Outstanding Loan Balance                    0.80               1.26             57.5 %   0.80       1.26                57.5 %
    (International)[5]
Fourth Quarter 2023 China Market Operational Highlights
    --  Cumulative registered users([6]) reached 155.6 million as of December
        31, 2023, an increase of 8.1% compared with December 31, 2022.
    --  Cumulative borrowers([7]) for the China market reached 25.2 million as
        of December 31, 2023, an increase of 6.8% compared with December 31,
        2022.
    --  Number of unique borrowers([8]) for the fourth quarter of 2023 was 2.1
        million, a decrease of 14.9% compared with the same period of 2022.
    --  Transaction volume([2]) reached RMB50.1 billion for the fourth quarter
        of 2023, an increase of 6.1% compared with the same period of 2022.
    --  Transaction volume facilitated for repeat individual borrowers([9]) for
        the fourth quarter of 2023 was RMB42.8 billion, an increase of 4.4%
        compared with the same period of 2022.
    --  Outstanding loan balance([4]) reached RMB66.1 billion as of December 31,
        2023, an increase of 3.6% compared with December 31, 2022.
    --  Average loan size([10] )was RMB9,044 for the fourth quarter of 2023,
        compared with RMB7,682 for the same period of 2022.
    --  Average loan tenure([11] )was 8.2 months for the fourth quarter of 2023,
        compared with 8.6 months for the same period of 2022.
    --  90 day+ delinquency ratio([12]) was 1.93% as of December 31, 2023,
        compared with 1.41% as of December 31, 2022.
Fourth Quarter 2023 International Market Operational Highlights
    --  Cumulative registered users([13]) reached 24.6 million as of December
        31, 2023, an increase of 58.7% compared with December 31, 2022.
    --  Cumulative borrowers([14]) for the international market reached 4.8
        million as of December 31, 2023, an increase of 41.2% compared with
        December 31, 2022.
    --  Number of unique borrowers([15]) for the fourth quarter of 2023 was 0.87
        million, an increase of 17.6% compared with the same period of 2022.
    --  Number of new borrowers([16]) for the fourth quarter of 2023 was 0.33
        million, an increase of 2.1% compared with the same period of 2022.
    --  Transaction volume([3]) reached RMB2.25 billion for the fourth quarter
        of 2023, an increase of 64.2% compared with the same period of 2022.
    --  Outstanding loan balance([5]) reached RMB1.26 billion as of December 31,
        2023, an increase of 57.5% compared with December 31, 2022.
    --  International business revenue was RMB602.1 million (US$84.8 million)
        for the fourth quarter of 2023, an increase of 52.5% compared with the
        same period of 2022, representing 18.7% of total revenue for the fourth
        quarter of 2023.
Fourth Quarter 2023 Financial Highlights
    --  Net revenue was RMB3,223.6 million (US$454.0 million) for the fourth
        quarter of 2023, an increase of 5.7% from RMB3,050.0 million for the
        same period of 2022.
    --  Net profit was RMB528.8 million (US$74.5 million) for the fourth quarter
        of 2023, a decrease of 4.9% from RMB556.3 million for the same period of
        2022.
    --  Non-GAAP adjusted operating income([17]), which excludes share-based
        compensation expenses before tax, was RMB547.0 million (US$77.0 million)
        for the fourth quarter of 2023, a decrease of 14.2% from RMB637.8
        million for the same period of 2022.
    --  Diluted net profit per American depositary share ("ADS") was RMB1.92
        (US$0.27) and diluted net profit per share was RMB0.38 (US$0.05) for the
        fourth quarter of 2023, remaining unchanged compared with the same
        period of 2022. Non-GAAP diluted net profit per ADS was RMB2.04
        (US$0.29) and non-GAAP diluted net profit per share was RMB0.41
        (US$0.06) for the fourth quarter of 2023, an increase of 2.5% compared
        with the same period of 2022. Each ADS of the Company represents five
        Class A ordinary shares of the Company.
     [1]
       Represents the total transaction volume facilitated in China's Mainland and the international markets on the Company's platforms during the period presented.


     [2]
       Represents our transaction volume facilitated in China's Mainland during the period presented.


     [3]
       Represents our transaction volume facilitated in international markets outside China's Mainland during the period presented.


     [4]
       Outstanding loan balance (China's Mainland) as of any date refers to the balance of outstanding loans in China's Mainland market excluding loans delinquent for more than 180 days from such date.


     [5]
      Outstanding loan balance (international) as of any date refers to the balance of outstanding loans in the international markets' excluding loans delinquent for more than 30 days from such date.


     [6]
      On a cumulative basis, the total number of users in China's Mainland market registered on the Company's platforms as of December 31, 2023.


     [7]
      On a cumulative basis, the total number of borrowers in China's Mainland market on the Company's platform as of December 31, 2023.


     [8]
      Represents the total number of borrowers in China's Mainland who have successfully borrowed on the Company's platform during the period presented.


     [9]
      Represents the transaction volume facilitated for the repeat borrowers in China's Mainland who successfully completed their transaction on the Company's platform during the period presented.


     [10]
      Represents the average loan size on the Company's platform in China's Mainland during the period presented.


     [11]
      Represents the average loan tenor on the Company's platform in China's Mainland during the period presented.


     [12]
       "90 day+ delinquency ratio" refers to the outstanding principal balance of on- and-off balance sheet loans that were 90 to 179 calendar days past due as a percentage of the total outstanding principal balance of on-and-off balance sheet loans on the Company's platform as of a specific date. Loans that originated outside China's Mainland are not included in the calculation.


     [13]
      On a cumulative basis, the total number of users registered on the Company's platforms outside China's Mainland market as of December 31, 2023.


     [14]
      On a cumulative basis, the total number of borrowers on the Company's platforms outside China's Mainland market during the period presented.


     [15]
      Represents the total number of borrowers outside China's Mainland who have successfully borrowed on the Company platforms during the period presented.


     [16]
      Represents the total number of new borrowers outside China's Mainland whose transactions were facilitated on the Company's platforms during the period presented.


     [17]
      Please refer to "UNAUDITED Reconciliation of GAAP And Non-GAAP Results" for reconciliation between GAAP and Non-GAAP adjusted operating income.
Mr. Tiezheng Li, Chief Executive Officer of FinVolution, commented, "We continued to grow our business across the board despite evolving macroeconomic challenges. Total transaction volume for full year 2023 reached RMB194.3 billion while total outstanding loan balance climbed to RMB67.4 billion, representing year-over-year increases of 10.8% and 4.3% respectively.
"Our international business grew exceptionally well in 2023, propelled by our effective strategy of pursuing sustained growth domestically in tandem with rapid growth overseas. International transaction volume for full-year 2023 soared to RMB7.85 billion and outstanding loan balance rose to RMB1.26 billion, representing increases of 84.7% and 57.5%, respectively. This accelerated growth drove international revenue to RMB2,136.9 million (US$301.0 million) for the full year 2023, up 85.9% year-over-year, representing 17.0% of total revenue," concluded Mr. Li.
Mr. Jiayuan Xu, FinVolution's Chief Financial Officer, continued, "Our strong full-year financial results speak for our outstanding strategic execution throughout 2023. Full-year net revenues increased to RMB12,547.4 million (US$1,767.3 million) and net profit reached RMB2,383.5 million (US$335.7 million), up 12.7% and 4.5%, respectively, year-over-year. Our total liquidity position as of December 31, 2023, stood at RMB7,930.1 million (US$1,116.9 million), representing a year-over-year increase of 12.3%.
"Moreover, we strove to continuously optimize shareholder returns through our capital return program. For full-year 2023, we deployed a total of approximately US$160.0 million in dividend distributions and share repurchases representing a capital return of 48.5% of the Company's net income for fiscal year 2023, demonstrating our steadfast commitment to enhancing shareholder value," concluded Mr. Xu.
Fourth Quarter 2023 Financial Results
Net revenue for the fourth quarter of 2023 increased by 5.7% to RMB3,223.6 million (US$454.0 million) from RMB3,050.0 million for the same period of 2022, primarily due to the increase in guarantee income.
Loan facilitation service fees decreased by 8.4% to RMB1,107.4 million (US$156.0 million) for the fourth quarter of 2023 from RMB1,208.6 million for the same period of 2022. This decrease was primarily due to the decrease in service fee rates, partially offset by the increase in transaction volume.
Post-facilitation service fees maintained relatively stable at RMB495.4 million (US$69.8 million) for the fourth quarter of 2023 from RMB496.4 million for the same period of 2022, as the result of the increase in outstanding loans served by the Company and the rolling impact of deferred transaction fees.
Guarantee income increased by 37.7% to RMB1,267.5 million (US$178.5 million) for the fourth quarter of 2023 from RMB920.6 million for the same period of 2022. This increase was primarily due to the increased outstanding loan balance of off-balance sheet loans, higher guarantee rates and the rolling impact of deferred guarantee income. The fair value of quality assurance commitment upon loan origination is released as guarantee income systematically over the term of the loans subject to quality assurance commitment.
Net interest income decreased by 22.3% to RMB227.4 million (US$32.0 million) for the fourth quarter of 2023, from RMB292.5 million for the same period of 2022, due to the decrease in loan volume and outstanding loan balances of on-balance sheet loans.
Other revenue decreased by 4.6% to RMB125.8 million (US$17.7 million) for the fourth quarter of 2023 from RMB131.8 million for the same period of 2022, primarily due to the disposal of a pilot-run business.
Origination, servicing expenses and other costs of revenue increased by 9.1% to RMB563.1 million (US$79.3 million) for the fourth quarter of 2023 from RMB516.2 million for the same period of 2022, primarily due to the increase in facilitation costs and loan collection expenses as a result of higher transaction volume.
Sales and marketing expenses remained relatively stable at RMB491.4 million (US$69.2 million) for the fourth quarter of 2023, compared with RMB490.7 million for the same period of 2022, as we maintained our proactive efforts in acquiring better quality borrowers in both China and the international markets.
Research and development expenses decreased by 7.2% to RMB127.6 million (US$18.0 million) for the fourth quarter of 2023 from RMB137.5 million for the same period of 2022, due to the increase in efficiency for technology development.
General and administrative expenses maintained relatively stable at RMB115.2 million (US$16.2 million) for the fourth quarter of 2023 from RMB114.4 million for the same period of 2022 as a result of stable operating efficiency.
Provision for accounts receivable and contract assets decreased by 67.6% to RMB36.4 million (US$5.1 million) for the fourth quarter of 2023 from RMB112.5 million for the same period of 2022, due to the decrease in provision from other third-party platforms.
Provision for loans receivable decreased by 14.6% to RMB107.6 million (US$15.2 million) for the fourth quarter of 2023, from RMB126.0 million for the same period of 2022, primarily due to the decrease in loan volume and outstanding loan balances of on-balance sheet loans, partially offset by the rise in delinquency rate.
Credit losses for quality assurance commitment increased by 35.6% to RMB1,269.5 million (US$178.8 million) for the fourth quarter of 2023 compared with RMB935.9 million for the same period of 2022. The increase was primarily due to the increases in loan volume and outstanding loan balances in both China and the international markets.
Operating profit decreased by 16.9% to RMB512.8 million (US$72.2 million) for the fourth quarter of 2023 from RMB616.8 million for the same period of 2022.
Non-GAAP adjusted operating income, which excludes share-based compensation expenses before tax, was RMB547.0 million (US$77.0 million) for the fourth quarter of 2023, representing a decrease of 14.2% from RMB637.8 million for the same period of 2022.
Other income increased by 4.8% to RMB67.6 million (US$9.5 million) for the fourth quarter of 2023 from RMB64.5 million for the same period of 2022, mainly due to the additional gains from increased investment in investment products and interest income.
Income tax expense was RMB51.6 million (US$7.3 million) for the fourth quarter of 2023, compared with RMB125.0 million for the same period of 2022. This decrease was mainly due to the decrease in pre-tax profit and the change in effective tax-rate in the fourth quarter.
Net profit was RMB528.8 million (US$74.5 million) for the fourth quarter of 2023, compared with RMB556.3 million for the same period of 2022.
Net profit attributable to ordinary shareholders of the Company was RMB524.6 million (US$73.9 million) for the fourth quarter of 2023, compared with RMB551.5 million for the same period of 2022.
Diluted net profit per ADS was RMB1.92 (US$0.27) and diluted net profit per share was RMB0.38 (US$0.05) for the fourth quarter of 2023, which remained unchanged compared with the same period of 2022. Non-GAAP diluted net profit per ADS was RMB2.04 (US$0.29) and non-GAAP diluted net profit per share was RMB0.41 (US$0.06) for the fourth quarter of 2023, an increase of 2.5% compared with the same period of 2022. Each ADS represents five Class A ordinary shares of the Company.
As of December 31, 2023, the Company had cash and cash equivalents of RMB4,969.3 million (US$699.9 million) and short-term investments, mainly in wealth management products and term deposit, of RMB2,960.8 million (US$417.0 million).
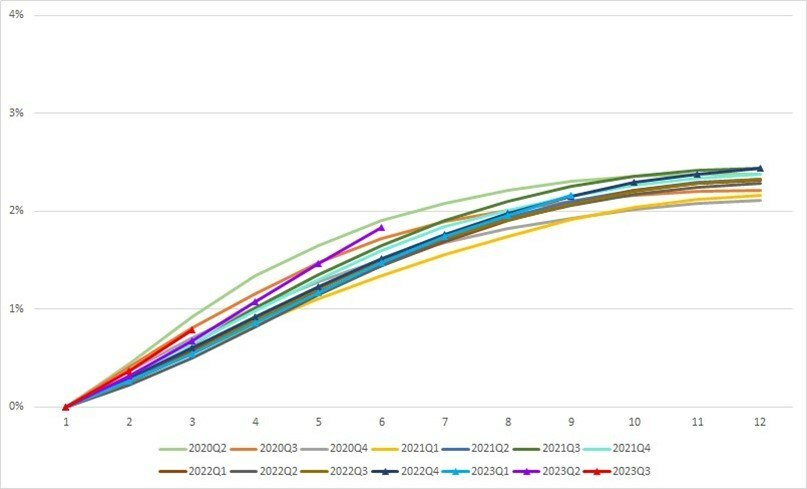
The following chart and table display the historical cumulative 30-day plus past due delinquency rates by loan origination vintage in China's Mainland for all loan products facilitated through the Company's online platform as of December 31, 2023:
Click here to view the chart.
Fiscal Year 2023 Financial Results
Net revenue for 2023 increased by 12.7% to RMB12,547.4 million (US$1,767.3 million) from RMB11,134.2 million in 2022, primarily due to the increase in loan facilitation service fees, post facilitation service fees and the increase in guarantee income as a result of the increase in transaction volume. The increase in net revenue was partially offset by the decrease in the average rate of transaction fees.
Loan facilitation service fees increased by 2.0% to RMB4,520.5 million (US$636.7 million) for 2023 from RMB4,430.8 million in 2022, primarily due to the increase in loan volume, partially offset by the decrease in average rate of transaction fees.
Post-facilitation service fees increased by 2.1% to RMB1,969.7 million (US$277.4 million) for 2023 from RMB1,929.9 million in 2022, primarily due to the increase in outstanding loans served by the Company and the rolling impact of deferred transaction fees, partially offset by the decrease in the average rate of transaction fees.
Guarantee income increased by 46.2% to RMB4,479.0 million (US$630.9 million) for 2023 from RMB3,064.4 million in 2022. This increase was primarily due to the increased outstanding loan balance of off-balance sheet loans, higher guarantee rates and the rolling impact of deferred guarantee income. The fair value of quality assurance commitment upon loan origination is released as guarantee income systematically over the term of the loans subject to quality assurance commitment.
Net interest income for 2023 decreased by 10.6% to RMB1,049.4 million (US$147.8 million) compared with RMB1,174.2 million in 2022, due to the decrease in loan volume and outstanding loan balances of on-balance sheet loans.
Other revenue decreased by 1.1% to RMB528.9 million (US$74.5 million) for 2023 from RMB534.9 million in 2022, as a result of the disposal of a pilot-run business.
Origination, servicing expenses and other cost of revenue increased by 3.6% to RMB2,111.5 million (US$297.4 million) for 2023 from RMB2,038.6 million in 2022, primarily due to the increase in facilitation costs and loan collection expenses as a result of higher transaction volume.
Sales and marketing expenses increased by 12.0% to RMB1,887.4 million (US$265.8 million) for 2023 from RMB1,685.0 million in 2022, as a result of proactive customer acquisition efforts focusing on higher-quality borrowers in both domestic and international markets.
Research and development expenses increased by 4.0% to RMB511.0 million (US$72.0 million) for 2023, compared with RMB491.5 million in 2022, primarily due to the increased investment in technology development.
General and administrative expenses decreased by 2.9% to RMB390.0 million (US$54.9 million) for 2023 from RMB401.7 million in 2022, mainly due to the increase in operating efficiencies.
Provision for accounts receivable and contract assets decreased by 35.0% to RMB253.9 million (US$35.8 million) for 2023, compared with RMB390.9 million in 2022, due to the decrease in provision from other third-party platforms.
Provision for loans receivables increased by 41.1% to RMB586.8 million (US$82.7 million) for 2023, compared with RMB415.9 million in 2022, primarily due to the increase in loan volume in international markets.
Credit losses for quality assurance commitment increased by 38.4% to RMB4,422.8 million (US$622.9 million) for 2023, compared with RMB3,195.2 million in 2022, primarily due to the increase in loan volume and outstanding loan balance.
Operating profit decreased by 5.2% to RMB2,383.9 million (US$335.8 million) for 2023 from RMB2,515.3 million in 2022.
Non-GAAP adjusted operating income, which excludes share-based compensation expenses before tax, was RMB2,500.3 million (US$352.2 million) for 2023, representing a decrease of 4.0% from RMB2,604.4 million in 2022.
Other income increased by 78.8% to RMB394.7 million (US$55.6 million) for 2023, from RMB220.7 million in 2022, primarily due to additional gains from increased investment in investment products.
Income tax expenses were RMB395.1 million (US$55.6 million) for 2023, compared with RMB454.8 million in 2022, mainly due to the change in the effective tax rate from the same period last year.
Net profit was RMB2,383.5 million (US$335.7 million) for 2023, compared with RMB2,281.3 million in 2022.
Net profit attributable to ordinary shareholders of the Company was RMB2,340.8 million (US$329.7 million) for 2023, compared with RMB2,266.4 million in 2022.
Shares Repurchase Update
For the fiscal year of 2023, the Company deployed a total of US$97.6 million to repurchase its own Class A ordinary shares in the form of ADSs in the market. As of December 31, 2023, in combination with the Company's historical and existing share repurchase programs, the Company had cumulatively repurchased its own Class A ordinary shares in the form of ADSs with a total aggregate value of approximately US$280.0 million over a period of six years.
Change of Management
The Board of Directors of the Company (the "Board") has appointed Ms. Pingping Chen to assume the role of President, effective March 18, 2024. She will serve as President and Chief Compliance Officer of the Company while retaining her current responsibilities across legal, compliance, human resources and internal controls, which she has held since 2019. Ms. Chen was the Chief Executive Officer of Pai Pai Xin, from 2016 to 2018. Prior to that, she held the position of Vice President of the Company, overseeing the legal, compliance, government relations, and innovation departments from 2013 to 2016. With this long and distinguished tenure at the Company, Ms. Chen brings a wealth of valuable institutional knowledge and deep experience to her new role. Ms. Chen received her master's degree in law from Fudan University and her EMBA from the China Europe International Business School.
Business Outlook
While the macroeconomic recovery continued to gain traction with pockets of improvement in the beginning of 2024, uncertainties persist in the markets in which we operate. The Company has observed encouraging signs of recovery and will continue to closely monitor macro conditions across our pan-Asian markets and remain prudent in our business operations. Given this backdrop, the Company currently expects its full-year 2024 transaction volume for the China market to be in the range of RMB195.7 billion to RMB205.0 billion, representing year-over-year growth of approximately 5.0% to 10.0%. At the same time, the Company expects full-year 2024 transaction volume for its international markets to be in the range of RMB9.4 billion to RMB11.0 billion, representing year-over-year growth of approximately 20.0% to 40.0%.
The above forecast is based on the current market conditions and reflects the Company's current preliminary views and expectations on market and operational conditions and the regulatory and operating environment, as well as customer and institutional partners' demands, all of which are subject to change.
Conference Call
The Company's management will host an earnings conference call at 8:30 p.m. U.S. Eastern Time on March 18, 2024 (8:30 a.m. Beijing/Hong Kong Time on March 19, 2024).
Dial-in details for the earnings conference call are as follows:
     United States (toll free):    +1-888-346-8982


     Canada (toll free):           +1-855-669-9657


     International:                +1-412-902-4272


     Hong Kong, China (toll free): 800-905-945


     Hong Kong, China:             +852-3018-4992


     Mainland, China:              400-120-1203
Participants should dial in at least five minutes before the scheduled start time and ask to be connected to the call for "FinVolution Group."
Additionally, a live and archived webcast of the conference call will be available on the Company's investor relations website at https://ir.finvgroup.com.
A replay of the conference call will be accessible approximately one hour after the conclusion of the live call until March 25, 2024, by dialing the following telephone numbers:
     United States (toll free): +1-877-344-7529


     Canada (toll free):        +1-855-669-9658


     International:             +1-412-317-0088


     Replay Access Code:                4318516
About FinVolution Group
FinVolution Group is a leading fintech platform with strong brand recognition in China and the international markets connecting borrowers of the young generation with financial institutions. Established in 2007, the Company is a pioneer in China's online consumer finance industry and has developed innovative technologies and has accumulated in-depth experience in the core areas of credit risk assessment, fraud detection, big data and artificial intelligence. The Company's platforms, empowered by proprietary cutting-edge technologies, features a highly automated loan transaction process, which enables a superior user experience. As of December 31, 2023, the Company had over 180.2 million cumulative registered users across China, Indonesia and the Philippines.
For more information, please visit https://ir.finvgroup.com
Use of Non-GAAP Financial Measures
We use non-GAAP adjusted operating income, non-GAAP operating margin, non-GAAP net profit, non-GAAP net profit attributable to FinVolution Group, and non-GAAP basic and diluted net profit per share and per ADS which are non-GAAP financial measures, in evaluating our operating results and for financial and operational decision-making purposes. We believe that these non-GAAP financial measures help identify underlying trends in our business by excluding the impact of share-based compensation expenses and expected discretionary measures. We believe that non-GAAP financial measures provide useful information about our operating results, enhance the overall understanding of our past performance and future prospects and allow for greater visibility with respect to key metrics used by our management in its financial and operational decision-making.
Non-GAAP adjusted operating income, non-GAAP operating margin, non-GAAP net profit, non-GAAP net profit attributable to FinVolution Group, and non-GAAP basic and diluted net profit per share and per ADS are not defined under U.S. GAAP and are not presented in accordance with U.S. GAAP. These non-GAAP financial measures have limitations as analytical tool, and when assessing our operating performance, cash flows or our liquidity, investors should not consider it in isolation, or as a substitute for net income, cash flows provided by operating activities or other consolidated statements of operation and cash flow data prepared in accordance with U.S. GAAP. The Company encourages investors and others to review our financial information in its entirety and not rely on a single financial measure.
For more information on this non-GAAP financial measure, please see the table captioned "Reconciliations of GAAP and Non-GAAP results" set forth at the end of this press release.
Exchange Rate Information
This announcement contains translations of certain RMB amounts into U.S. dollars at a specified rate solely for the convenience of the reader. Unless otherwise noted, all translations from RMB to U.S. dollars are made at a rate of RMB7.0999 to US$1.00, the rate in effect as of December 29, 2023 as certified for customs purposes by the Federal Reserve Bank of New York.
Safe Harbor Statement
This press release contains forward-looking statements. These statements constitute "forward-looking" statements within the meaning of Section 21E of the Securities Exchange Act of 1934, as amended, and as defined in the U.S. Private Securities Litigation Reform Act of 1995. These forward-looking statements can be identified by terminology such as "will," "expects," "anticipates," "future," "intends," "plans," "believes," "estimates," "target," "confident" and similar statements. Such statements are based upon management's current expectations and current market and operating conditions and relate to events that involve known or unknown risks, uncertainties and other factors, all of which are difficult to predict and many of which are beyond the Company's control. Forward-looking statements involve risks, uncertainties and other factors that could cause actual results to differ materially from those contained in any such statements. Potential risks and uncertainties include, but are not limited to, uncertainties as to the Company's ability to attract and retain borrowers and investors on its marketplace, its ability to increase volume of loans facilitated through the Company's marketplace, its ability to introduce new loan products and platform enhancements, its ability to compete effectively, laws, regulations and governmental policies relating to the online consumer finance industry in China, general economic conditions in China, and the Company's ability to meet the standards necessary to maintain listing of its ADSs on the NYSE, including its ability to cure any non-compliance with the NYSE's continued listing criteria. Further information regarding these and other risks, uncertainties or factors is included in the Company's filings with the U.S. Securities and Exchange Commission. All information provided in this press release is as of the date of this press release, and FinVolution does not undertake any obligation to update any forward-looking statement as a result of new information, future events or otherwise, except as required under applicable law.
For investor and media inquiries, please contact:
In China:
FinVolution Group
Head of Investor Relations
Jimmy Tan, IRC
Tel: +86 (21) 8030-3200 Ext. 8601
E-mail: ir@xinye.com
Piacente Financial Communications
Jenny Cai
Tel: +86 (10) 6508-0677
E-mail: finv@tpg-ir.com
In the United States:
Piacente Financial Communications
Brandi Piacente
Tel: +1-212-481-2050
E-mail: finv@tpg-ir.com
FinVolution Group
UNAUDITED INTERIM CONDENSED CONSOLIDATED BALANCE SHEETS
(All amounts in thousands, except share data, or otherwise noted)
As of December
31, As of December 31,
2022 2023
RMB RMB USD
Assets
Cash and cash equivalents 3,636,380 4,969,319 699,914
Restricted cash 2,842,707 1,800,071 253,535
Short-term investments 3,427,020 2,960,821 417,023
Investments 1,084,084 1,135,133 159,880
Quality assurance receivable, net of credit loss allowance for 1,669,855 1,755,615 247,273
quality assurance receivable of RMB374,304 and
RMB529,392 as of December 31, 2022 and December 31, 2023,
respectively
Intangible assets 98,692 98,692 13,900
Property, equipment and software, net 141,345 140,933 19,850
Loans receivable, net of credit loss allowance for loans receivable 2,136,432 1,127,388 158,789
of RMB294,355 and RMB214,550 as of December 31, 2022 and
December 31
, 2023, respectively
Accounts receivable and contract assets, net of credit loss 2,217,445 2,208,538 311,066
allowance for accounts receivable and contract assets of
RMB496,918 and RMB310,394 as of December 31, 2022 and
December 31
, 2023, respectively
Deferred tax assets 919,361 1,624,325 228,781
Right of use assets 192,428 38,110 5,368
Prepaid expenses and other assets 2,966,751 3,384,317 476,671
Goodwill 50,411 50,411 7,100
Total assets 21,382,911 21,293,673 2,999,150
Liabilities and Shareholders' Equity
Deferred guarantee income 1,805,164 1,882,036 265,079
Liability from quality assurance commitment 3,555,618 3,306,132 465,659
Payroll and welfare payable 274,408 261,528 36,835
Taxes payable 134,027 207,477 29,223
Short-term borrowing loan - 5,756 811
Funds payable to investors of consolidated trusts 1,845,210 436,352 61,459
Contract liability 5,109 5,109 720
Deferred tax liabilities 232,188 340,608 47,974
Accrued expenses and other liabilities 909,708 941,899 132,664
Leasing liabilities 176,990 35,878 5,053
Total liabilities 8,938,422 7,422,775 1,045,477
Commitments and contingencies
FinVolution Group Shareholders' equity
Ordinary shares 103 103 15
Additional paid-in capital 5,692,703 5,748,734 809,692
Treasury stock (568,595) (1,199,683) (168,972)
Statutory reserves 698,401 762,472 107,392
Accumulated other comprehensive income 52,237 80,006 11,267
Retained Earnings 6,496,852 8,357,153 1,177,080
Total FinVolution Group shareholders' equity 12,371,701 13,748,785 1,936,474
Non-controlling interest 72,788 122,113 17,199
Total shareholders' equity 12,444,489 13,870,898 1,953,673
Total liabilities and shareholders' equity 21,382,911 21,293,673 2,999,150
FinVolution Group
UNAUDITED INTERIM CONDENSED CONSOLIDATED STATEMENTS OF COMPREHENSIVE INCOME
(All amounts in thousands, except share data, or otherwise noted)
For the Three Months Ended December 31, For the Year Ended December 31,
2022 2023 2022 2023
RMB RMB USD RMB RMB USD
Operating revenue:
Loan facilitation service fees 1,208,636 1,107,434 155,979 4,430,778 4,520,504 636,700
Post-facilitation service fees 496,434 495,431 69,780 1,929,913 1,969,705 277,427
Guarantee income 920,570 1,267,515 178,526 3,064,440 4,478,995 630,853
Net interest income 292,512 227,426 32,032 1,174,204 1,049,379 147,802
Other Revenue 131,824 125,791 17,717 534,868 528,862 74,489
Net revenue 3,049,976 3,223,597 454,034 11,134,203 12,547,445 1,767,271
Operating expenses:
Origination, servicing expenses and other cost of (516,223) (563,142) (79,317) (2,038,624) (2,111,515) (297,401)
revenue
Sales and marketing expenses (490,735) (491,381) (69,210) (1,685,022) (1,887,442) (265,841)
Research and development expenses (137,519) (127,605) (17,973) (491,484) (510,986) (71,971)
General and administrative expenses (114,358) (115,209) (16,227) (401,731) (390,022) (54,933)
Provision for accounts receivable
and contract assets (112,495) (36,413) (5,129) (390,882) (253,948) (35,768)
Provision for loans receivable (125,969) (107,562) (15,150) (415,902) (586,843) (82,655)
Credit losses for quality assurance commitment (935,903) (1,269,514) (178,807) (3,195,220) (4,422,802) (622,939)
Total operating expenses (2,433,202) (2,710,826) (381,813) (8,618,865) (10,163,558) (1,431,508)
Operating profit 616,774 512,771 72,221 2,515,338 2,383,887 335,763
Other income, net 64,524 67,633 9,526 220,693 394,698 55,592
Profit before income tax expense 681,298 580,404 81,747 2,736,031 2,778,585 391,355
Income tax expenses (124,987) (51,572) (7,264) (454,775) (395,100) (55,649)
Net profit 556,311 528,832 74,483 2,281,256 2,383,485 335,706
Net profit attributable to non-controlling interest 4,836 4,273 602 14,874 42,650 6,007
shareholders
Net profit attributable to FinVolution Group 551,475 524,559 73,881 2,266,382 2,340,835 329,699
Foreign currency translation adjustment, net of nil tax (19,644) 8,855 1,247 69,006 (27,769) (3,911)
Total comprehensive income attributable 531,831 533,414 75,128 2,335,388 2,313,066 325,788
to FinVolution Group
Weighted average number of ordinary shares used in
computing net income per share
Basic 1,419,627,691 1,342,940,746 1,342,940,746 1,412,648,862 1,374,713,018 1,374,713,018
Diluted 1,445,075,313 1,367,430,282 1,367,430,282 1,454,291,316 1,402,947,561 1,402,947,561
Net profit per share attributable to FinVolution
Group's ordinary shareholders
Basic 0.39 0.39 0.06 1.60 1.70 0.24
Diluted 0.38 0.38 0.05 1.56 1.67 0.24
Net profit per ADS attributable to FinVolution
Group's ordinary shareholders (one ADS equal
five ordinary shares)
Basic 1.94 1.95 0.28 8.02 8.51 1.20
Diluted 1.91 1.92 0.27 7.79 8.34 1.18
                FinVolution Group


                UNAUDITED INTERIM CONDENSED CONSOLIDATED STATEMENTS OF CASH FLOWS


                 (All amounts in thousands, except share data, or otherwise noted)


                                                                          Three Months Ended December 31,                                                                                   Year Ended December 31,


                                                                         2022                                                                                           2023                                        2022            2023


                                                                          RMB                                        RMB                                       USD           RMB            RMB                            USD


              Net cash provided by/(used in)                         301,407                                      56,150                                      7,909        268,833       1,413,423                         199,076
    operating activities


              Net cash provided by
              /(used in)            (471,881)                                  (102,748)                                  (14,472)   (1,553,228)      1,413,490                         199,086

              investing activities


               Net cash
              provided by
              /(
     used
                in)                                                 (445,808)                                (1,042,781)                                 (146,873)     (795,856)    (2,559,051)                      (360,435)

              financing activities


              Effect of exchange rate changes on                      19,129                                     (4,975)                                     (700)        67,797          22,441                           3,162
    cash and cash equivalents


              Net increase/(decrease) in cash, cash                (597,153)                                (1,094,354)                                 (154,136)   (2,012,454)        290,303                          40,889


               equivalent and restricted cash


              Cash, cash equivalent and restricted                 7,076,240                                   7,863,744                                  1,107,585      8,491,541       6,479,087                         912,560
    cash at beginning of period


              Cash, cash equivalent and restricted                 6,479,087                                   6,769,390                                    953,449      6,479,087       6,769,390                         953,449
    cash at end of period
                FinVolution Group


           UNAUDITED Reconciliation of GAAP and Non-GAAP Results


        (All amounts in thousands, except share data, or otherwise noted)


                                                                                                                                          For the Three Months Ended December
                                                                                                                                                 31,                                                     For the Year Ended December 31,


                                                                                                                          2022                                                      2023           2022                                         2023


                                                                                                                           RMB                           RMB                          USD           RMB                           RMB             USD


                Net Revenues                                                                             3,049,976                      3,223,597                       454,034     11,134,203                     12,547,445        1,767,271


              Less: total operating expenses                                                                      (2,433,202)                   (2,710,826)                    (381,813)   (8,618,865)                  (10,163,558)     (1,431,508)


                Operating Income                                                                           616,774                        512,771                        72,221      2,515,338                      2,383,887          335,763


              Add: share-based compensation expenses                                                                   20,998                         34,215                         4,819         89,030                        116,407           16,396


                Non-GAAP adjusted operating income                                                         637,772                        546,986                        77,040      2,604,368                      2,500,294          352,159


                Operating Margin                                                                            20.2 %                        15.9 %                       15.9 %        22.6 %                        19.0 %          19.0 %


                Non-GAAP operating margin                                                                   20.9 %                        17.0 %                       17.0 %        23.4 %                        19.9 %          19.9 %


                Non-GAAP adjusted operating income                                                         637,772                        546,986                        77,040      2,604,368                      2,500,294          352,159


              Add: other income, net                                                                                   64,524                         67,633                         9,526        220,693                        394,698           55,592


              Less: income tax expenses                                                                             (124,987)                      (51,572)                      (7,264)     (454,775)                     (395,100)        (55,649)


                Non-GAAP net profit                                                                        577,309                        563,047                        79,302      2,370,286                      2,499,892          352,102


              Net profit attributable to non-controlling interest                                                       4,836                          4,273                           602         14,874                         42,650            6,007


              shareholders


                Non-GAAP net profit attributable to FinVolution                                            572,473                        558,774                        78,700      2,355,412                      2,457,242          346,095
    Group


                Weighted average number of ordinary shares used in
    computing net income per share


              Basic                                                                                             1,419,627,691                  1,342,940,746                 1,342,940,746  1,412,648,862                  1,374,713,018    1,374,713,018


              Diluted                                                                                           1,445,075,313                  1,367,430,282                 1,367,430,282  1,454,291,316                  1,402,947,561    1,402,947,561


                Non-GAAP net profit per share attributable to
    FinVolution Group's ordinary shareholders


              Basic                                                                                                      0.40                           0.42                          0.06           1.67                           1.79             0.25


              Diluted                                                                                                    0.40                           0.41                          0.06           1.62                           1.75             0.25


                Non-GAAP net profit per ADS attributable to
    FinVolution Group's ordinary shareholders (one ADS
    equal five ordinary shares)


              Basic                                                                                                      2.02                           2.08                          0.29           8.34                           8.94             1.26


              Diluted                                                                                                    1.98                           2.04                          0.29           8.10                           8.76             1.23
View original content:https://www.prnewswire.com/news-releases/finvolution-group-reports-fourth-quarter-and-fiscal-year-2023-unaudited-financial-results-302091352.html
SOURCE FinVolution Group
